Higher Degree is the monthly macro read around the Nasdaq: U.S. equities, international, the dollar, gold, real estate, and bonds, each placed in its own wave structure and tied into one narrative. It maps the environment the weekly Nasdaq read has to trade inside.
Six markets, one story.
Week of Oct 1 · by Paul Johnson. Each of these moves in its own wave structure, and each one tells you something about the others. The dollar is the pivot again. DXY has ground back up to a 101.035 weekly close, half a point under the 101.80 level that flips it from tailwind to headwind for gold and international, and that reclaim is the one line every other sleeve is watching. Bonds already broke to fresh multi-year lows and real estate is taking that hit hardest. Equities sit dead even, a coin flip between a completed top and one more high.
Analysis as of 2026-10-01
Price as of 2026-10-01
A completed climb Neutral
S&P 500 · participate · benchmark weight · unconfirmed.
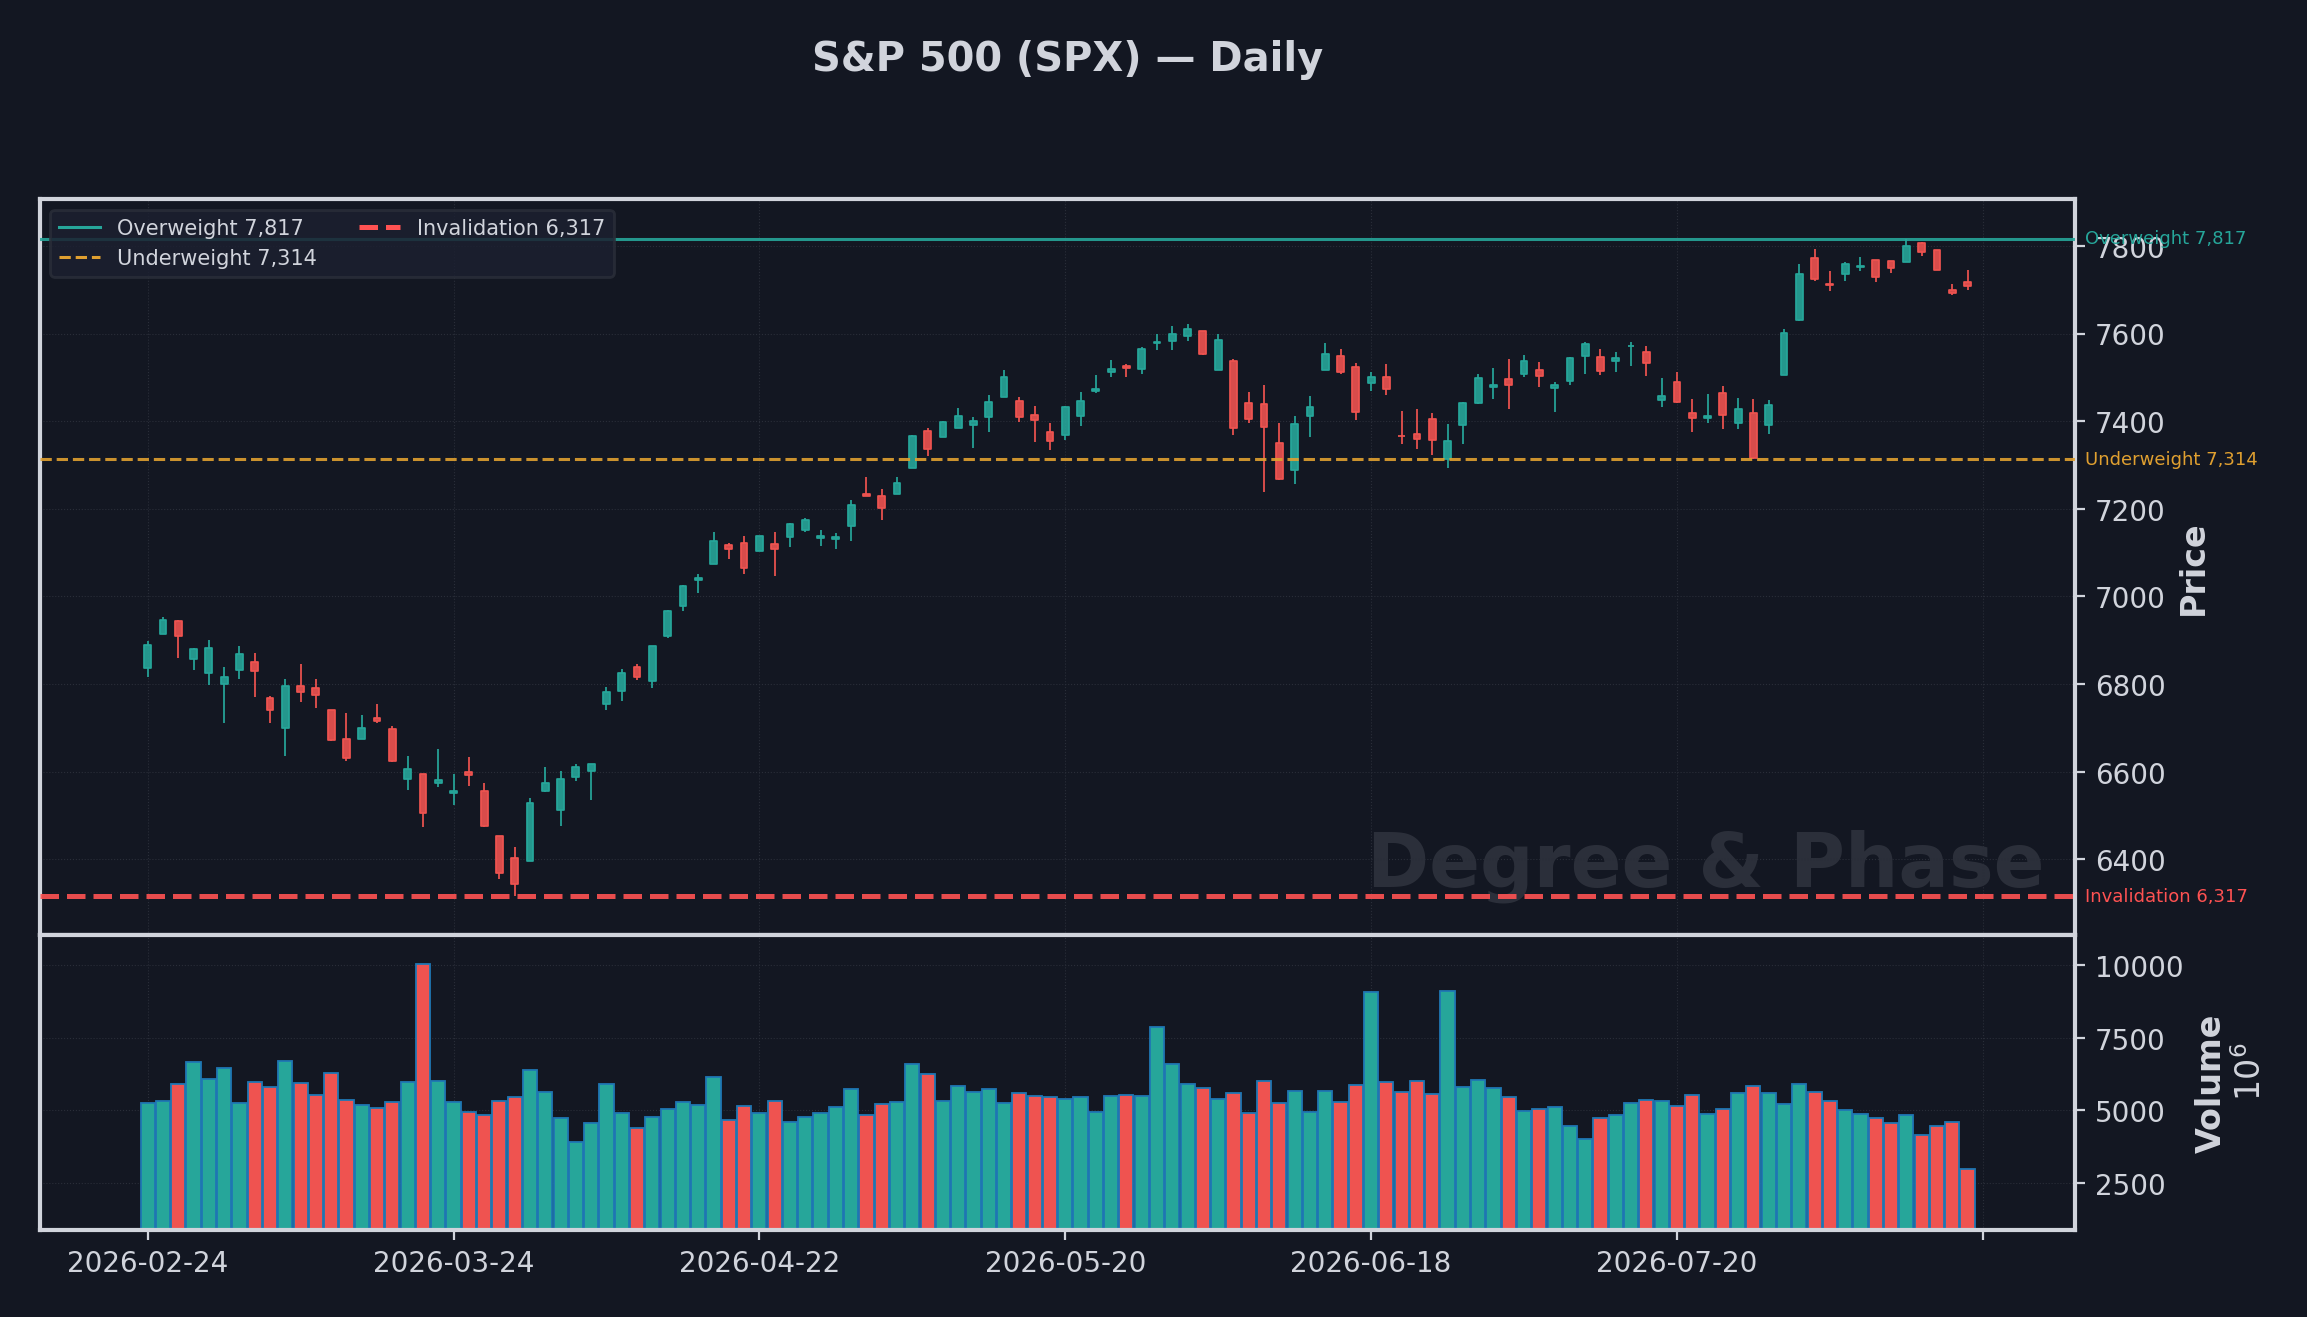
The climb from the 2022 low (3,491.58) to the ATH (7,816.70) is a complete, rule-legal extended fifth wave: the fifth ran 2.67 times the first, the most exhaustion-prone way a bull market can end. That still argues for a top. But the September pullback reversed hard, price is back to 7,743.41, just 0.9% off the high, and the two readings, top-in and one-more-high, now sit dead even. That's not a reason to lean either way. It's a reason to hold benchmark weight and let the market pick a side: a new high above 7,816.70 tips it bullish, a break of 7,313.92 puts the top read back in charge.
| Level | Price | Means |
|---|---|---|
| Engage correction | 7,313.92 | The correction is on |
| Major top confirmed | 6,316.91 | The top-is-in case confirms |
| Top-case dies (new high) | 7,816.70 | The fifth just extended; back to benchmark |
The cleanest call on the board Bullish
EFA · overweight · add on pullbacks.
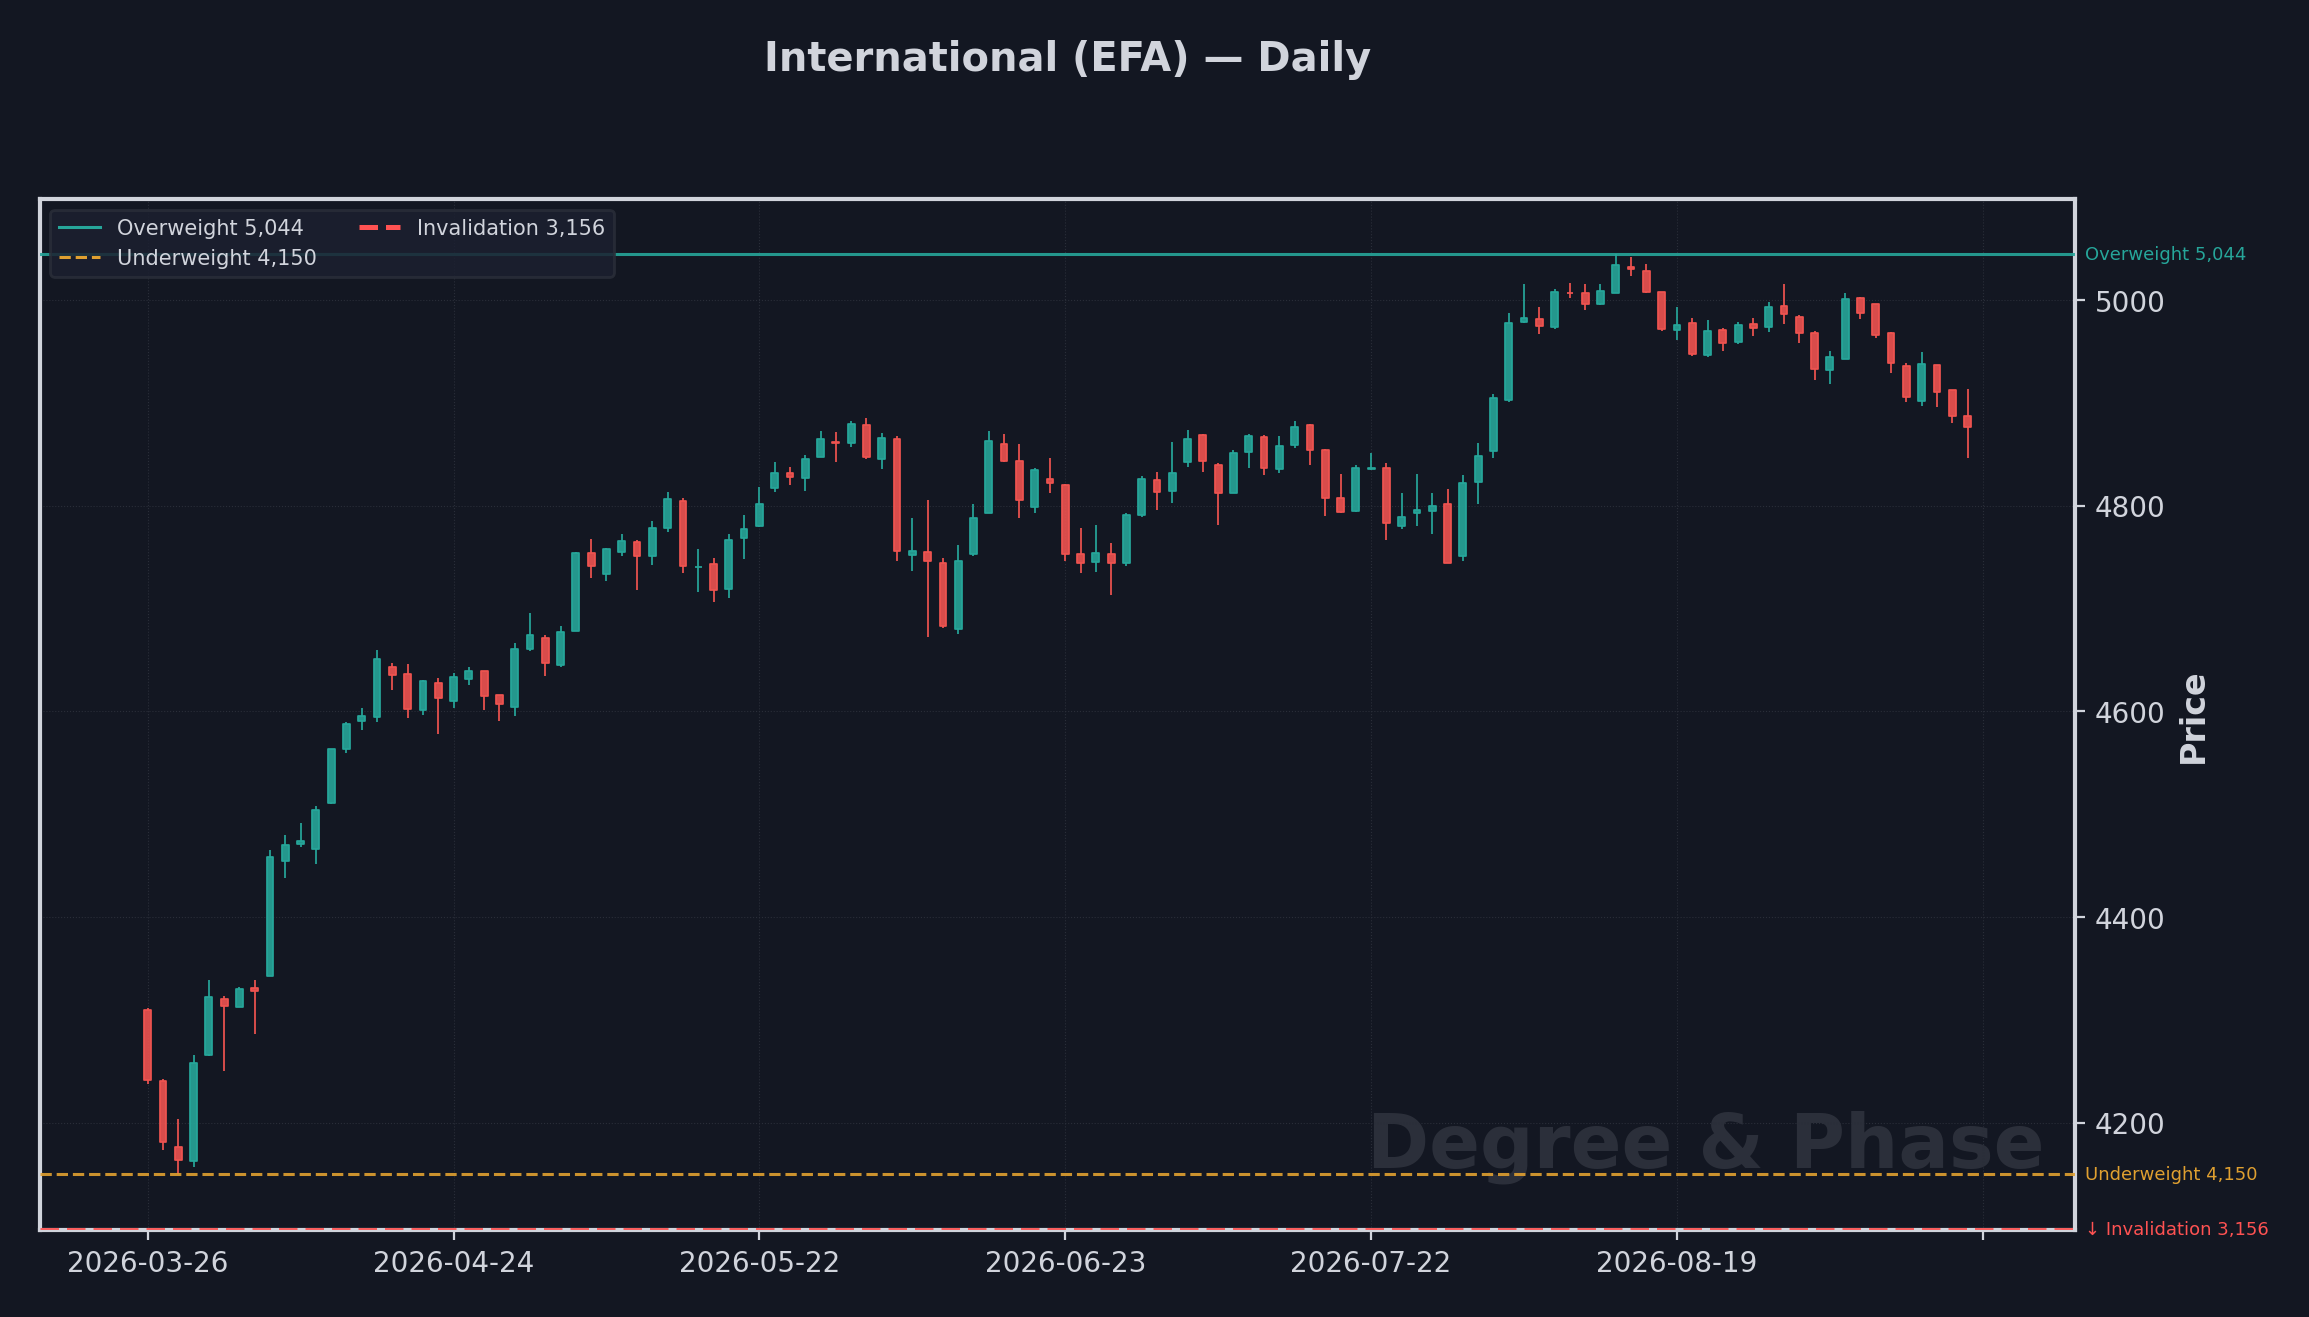
An 18-year base breakout: EFA cleared its 2007 ceiling (86.5) in May 2025 and has held above it for fifteen months. Under it, a clean five-wave advance off the 2022 low, now in an extended fifth parked exactly on its 1.618 extension: the spot where fifths die. So overweight, but add on pullbacks toward 4,150–4,400, don't chase at the extension. A falling dollar is a mechanical tailwind, but that 101.80 dollar reclaim is now the thing to watch: a weekly close above it presses this sleeve almost as hard as gold.
| Level | Price | Means |
|---|---|---|
| Breakout extends (new high) | 5,044.2 | The advance runs further |
| Fifth topped | 4,149.7 | The cleanest bull just topped |
| Buy zone | 4,400 | Add on the pullback, not the extension |
Read it first Neutral
DXY · the driver · participate.
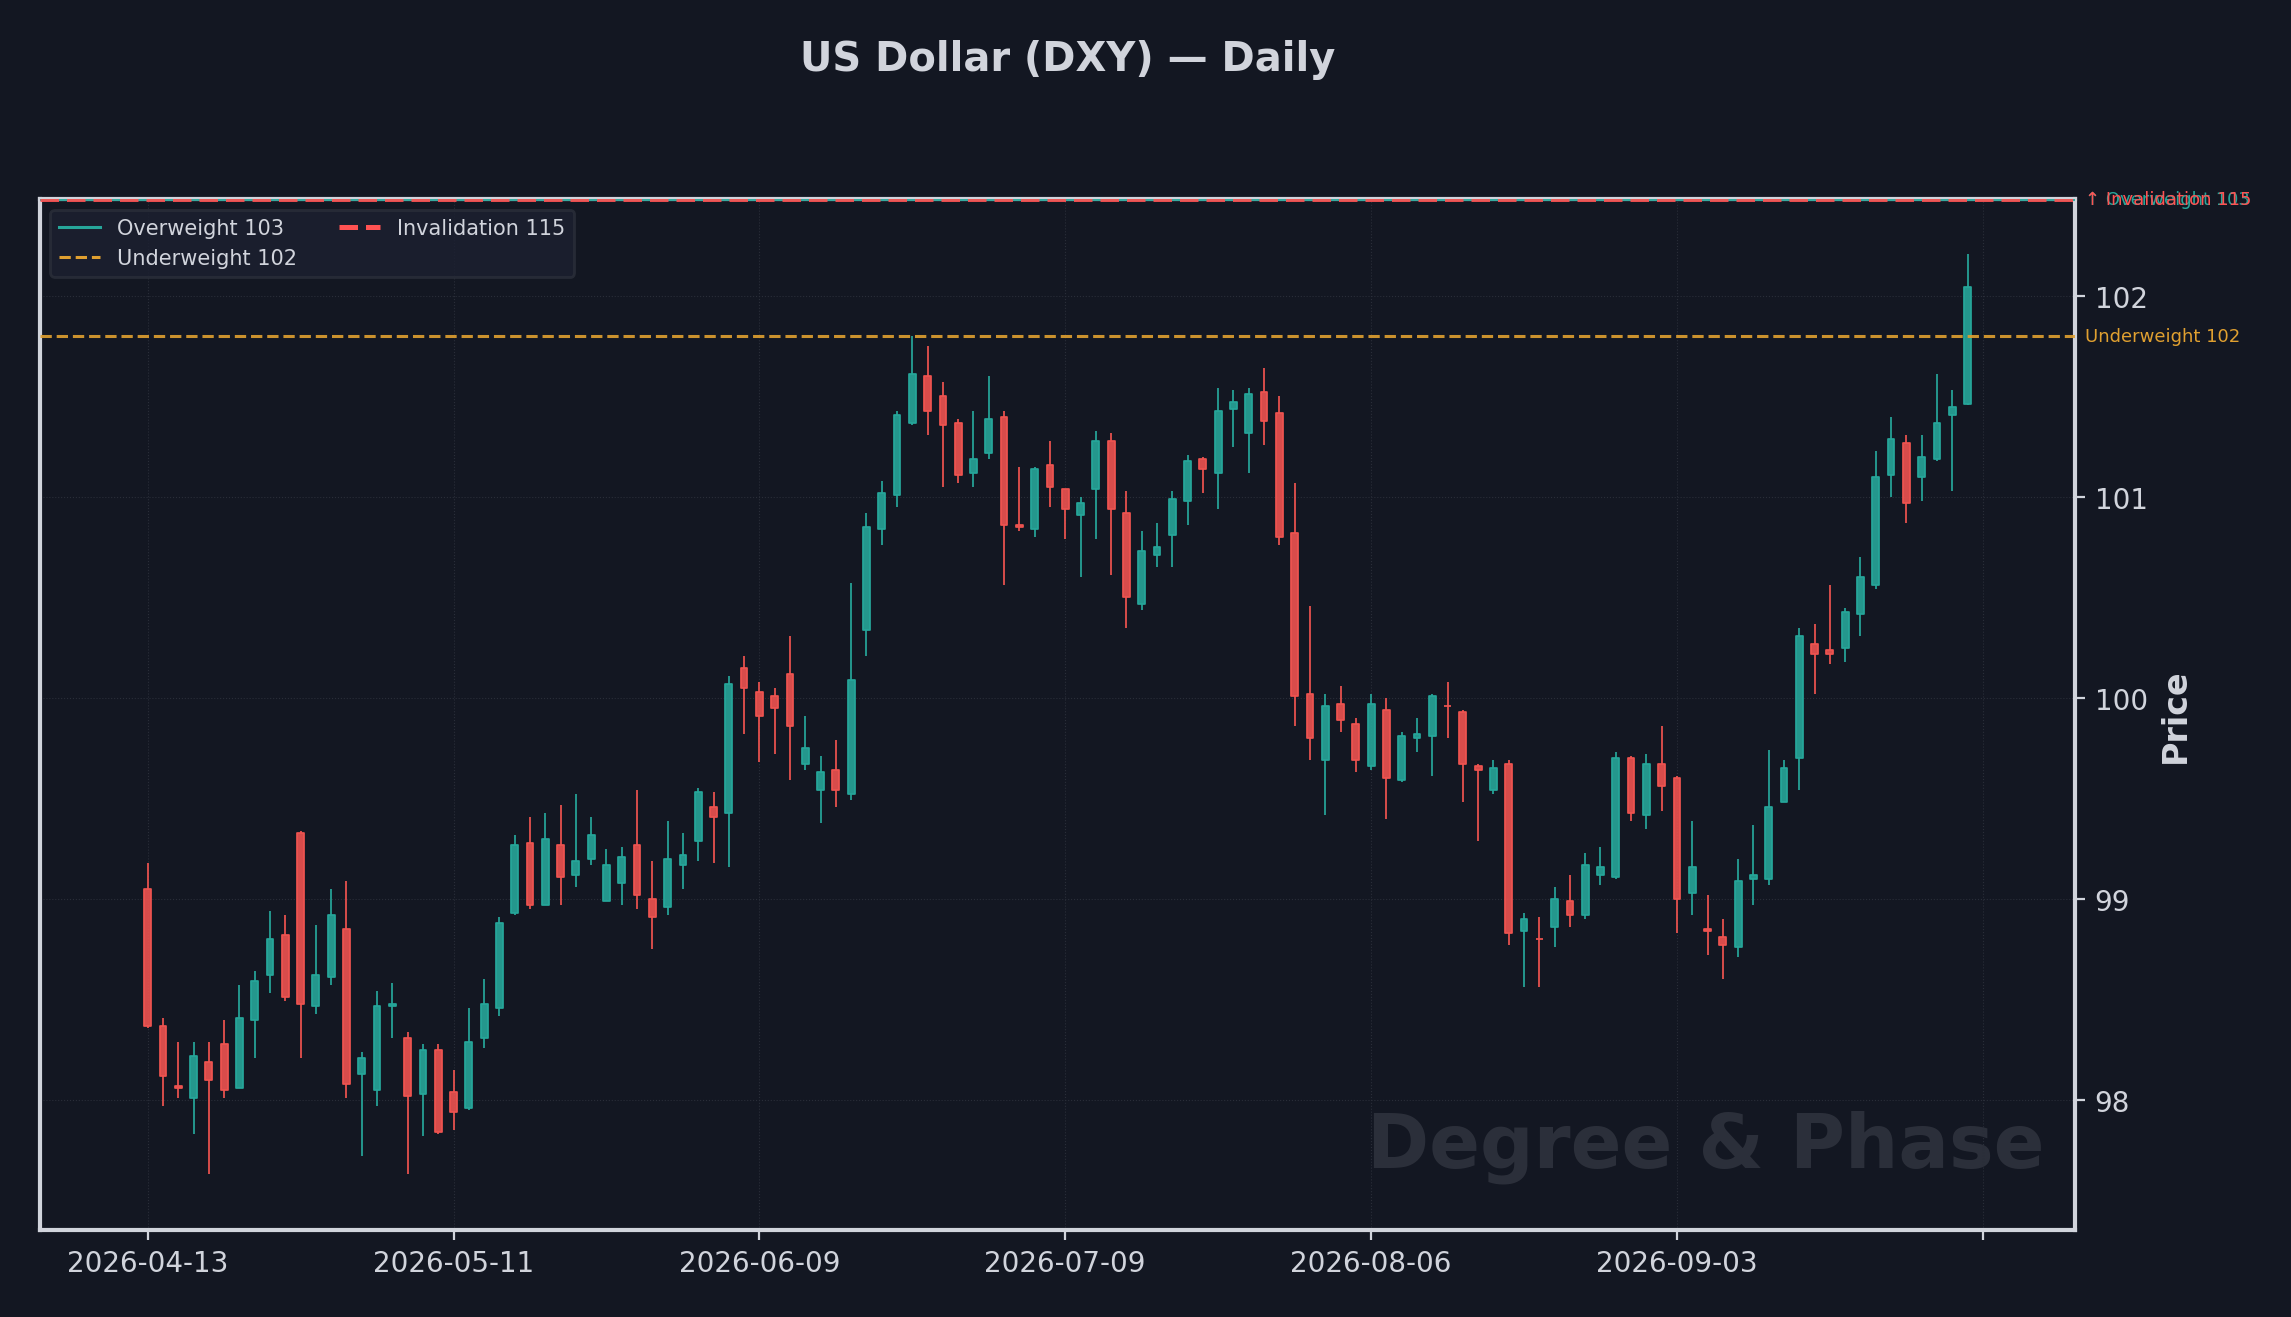
Structurally a Supercycle-degree zigzag down from the 1985 high (164.72). The leg off the 2022 high to the January-2026 low (95.55) is a completed A-B-C, and the bounce that was supposed to roll over into the next leg down hasn't. It's ground back up to a 101.035 weekly close, half a point under the 101.80 level that would flip this from corrective bounce to something the whole board has to respect. Here's the fork: hold under 101.80 and the dollar-down trade for gold and international keeps working; close above it and both of those sleeves take the hit at once. The most important line on the whole page, and it hasn't been crossed yet.
| Level | Price | Means |
|---|---|---|
| Decline resumes | 101.80 | Rotation into gold/international accelerates |
| Low is in / bases | 103.20 | The hike bites, that rotation stalls |
| Downside | 87.5–89.2 | The next shelf, then the low-80s over years |
A bull you don't chase Bullish
Gold · neutral tilt.
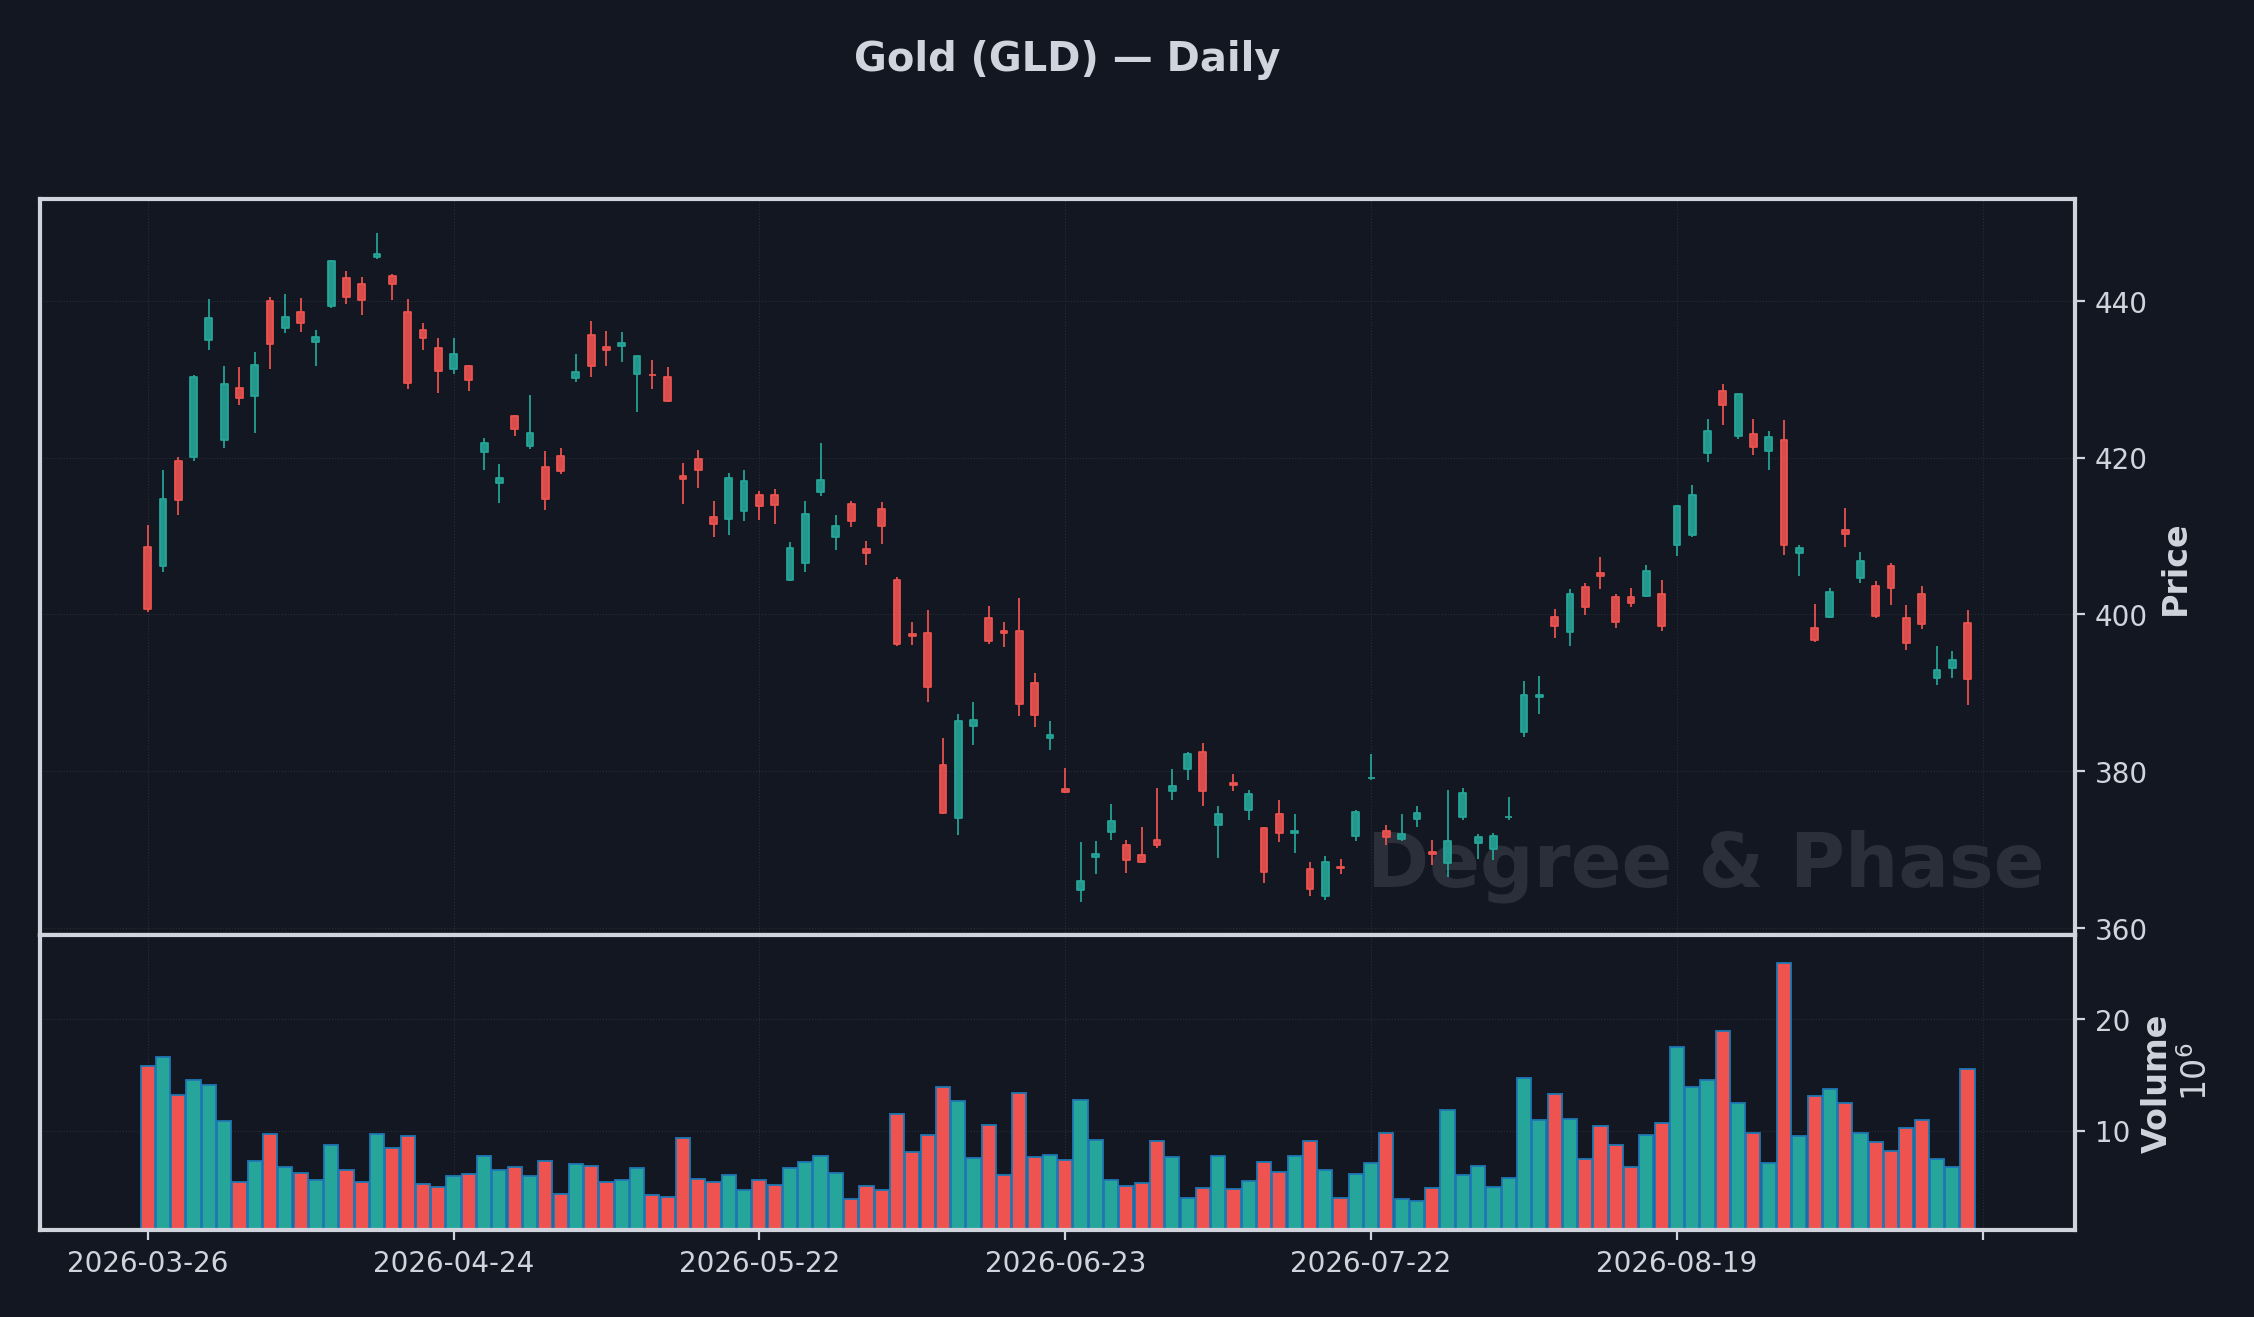
A secular bull since the 2001 low (255), now digesting the January 2026 blow-off, a near-vertical spike to 5,586 that reversed 13.6% intraday in a single session. The pullback bottomed (so far) at 3,962.5, down 29%, bounced to about 4,550, and has spent two weeks digesting sideways to lower around 4,300 to 4,440. The dollar-down trade is still the tailwind, but that's exactly what's at risk if DXY closes above 101.80. Until it does, this stays a bull you hold, not one you chase at these prices.
| Level | Price | Means |
|---|---|---|
| Correction done → new highs | 4,879.7 | Chase-worthy again |
| Bigger A-B-C engaged | 3,962.5 | The blow-off correction has another leg down |
| Upside targets | 6,666 / 8,040 | If the correction is done |
The laggard Bearish
VNQ · underweight · rate-sensitive.
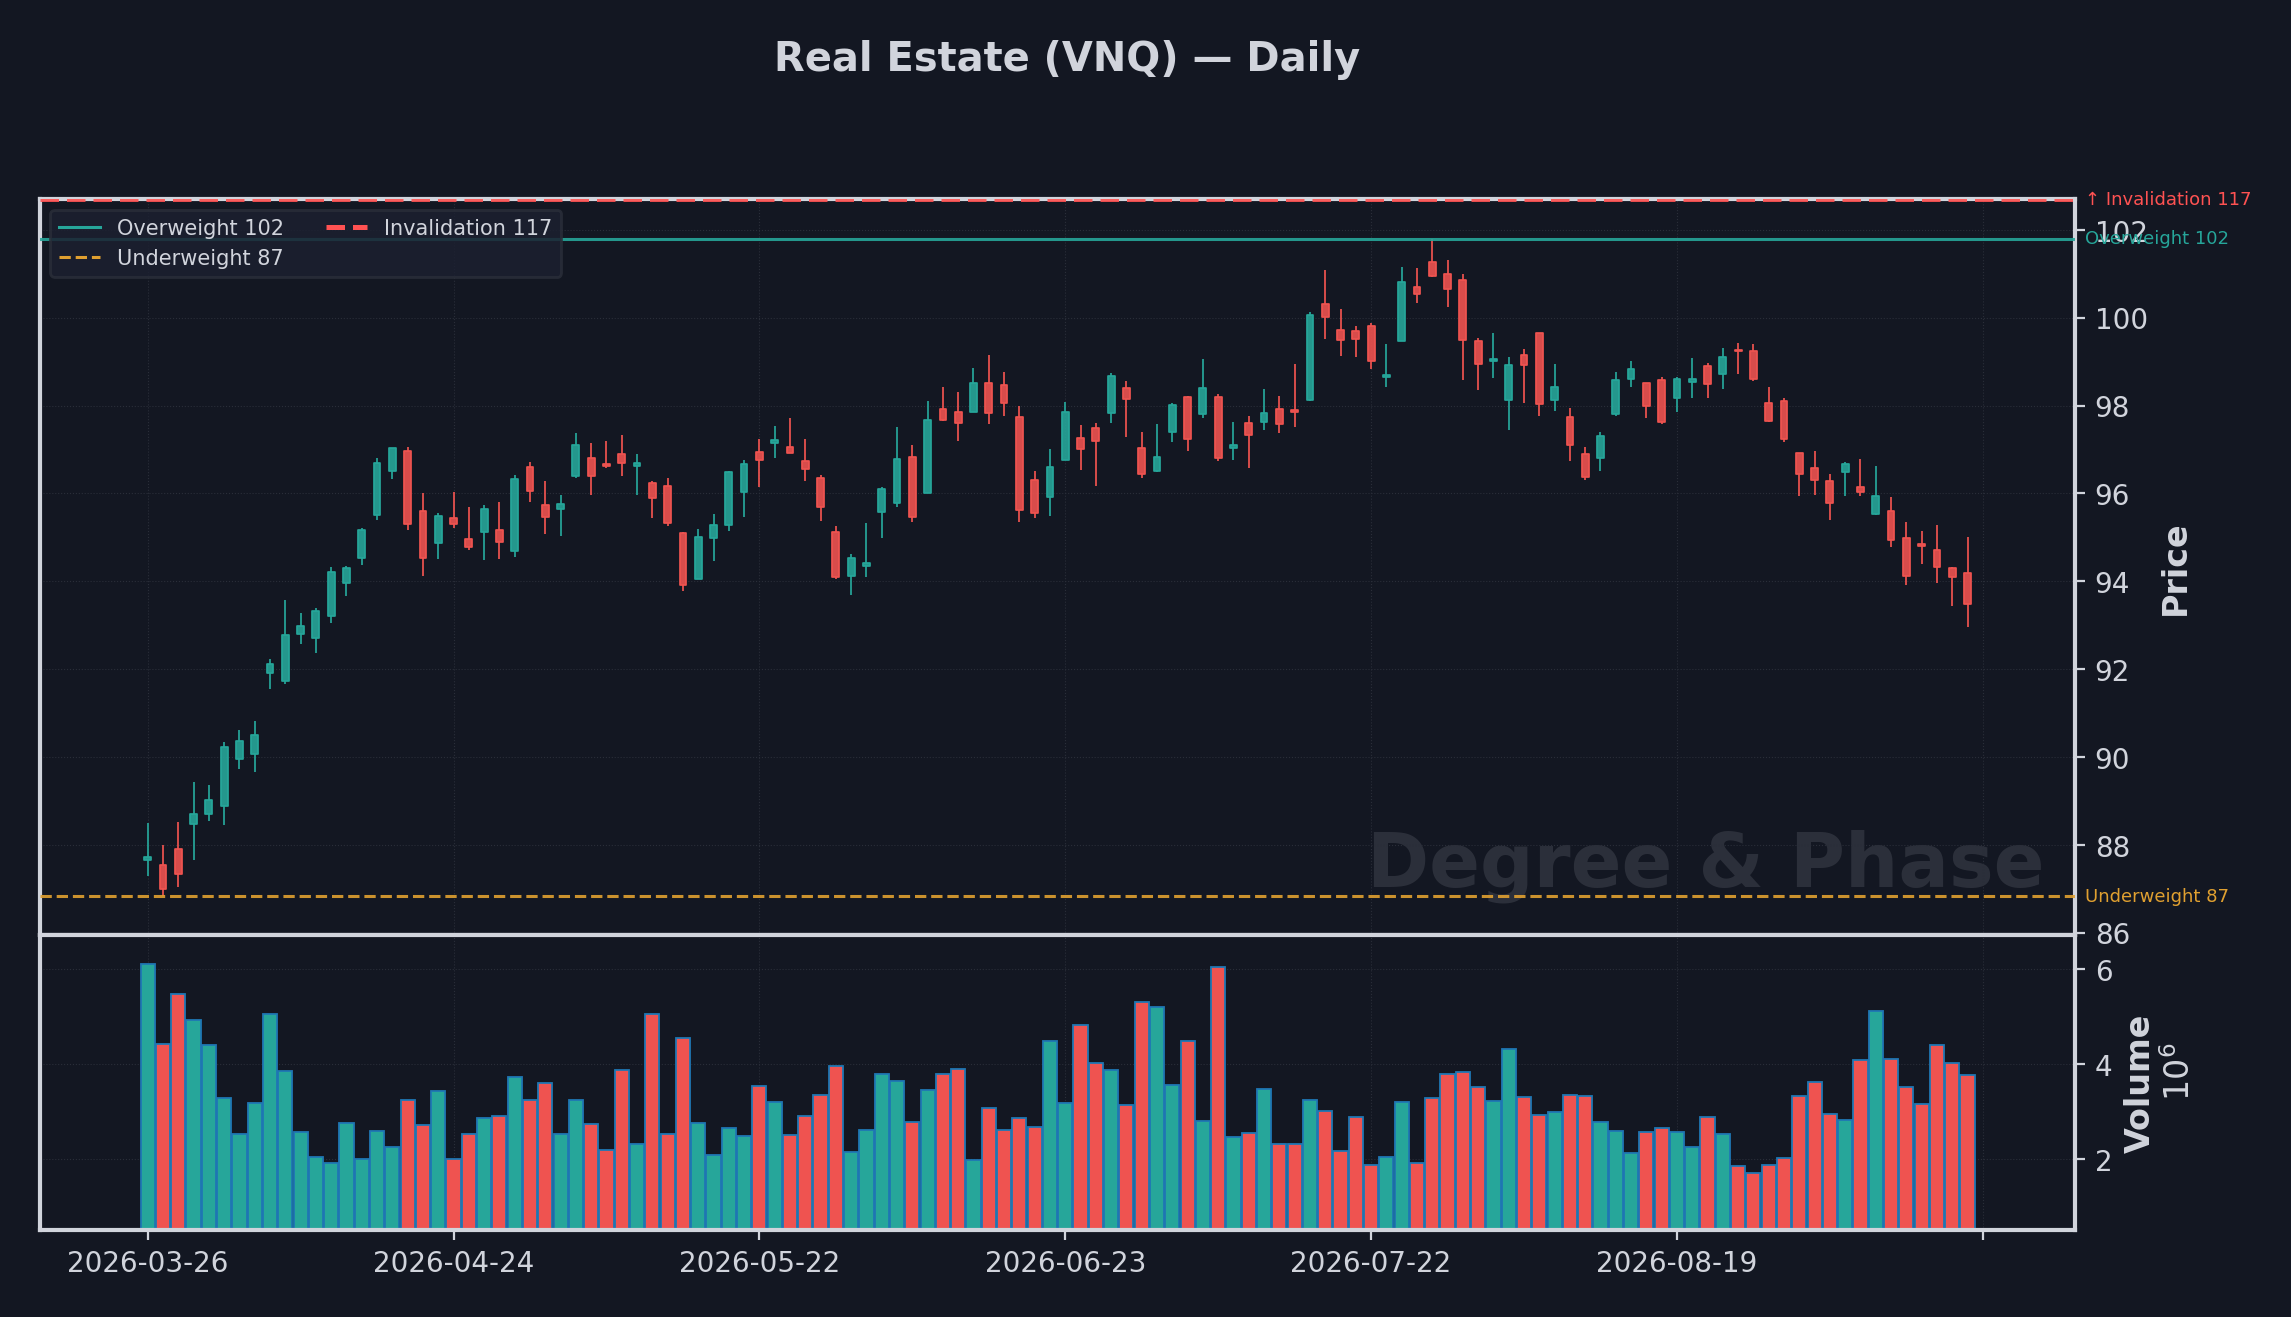
REITs are the laggard of the board: the 2023 recovery to 101.80 never got VNQ back to its 2021 peak (116.71), and that recovery reads as corrective, not a new bull. The wave-C decline everyone worried about isn't a worry anymore, it's happening: VNQ just made a fresh multi-year low at 90.99, about 22% under the ATH, and the drop is accelerating as the bonds sleeve breaks to new lows right alongside it. Same rate shock, worst-hit sleeve. A weekly hold above 101.80 would ease the call back toward neutral. Nothing in the tape says that yet.
| Level | Price | Means |
|---|---|---|
| Cuts the bearish read | 101.80 | The old "rates up, REITs down" reflex has broken |
| Deepens | 86.84 → 70.61 | The wave-C decline confirms and extends |
The clearest bear on the board Bearish
Bonds · underweight · defensive.
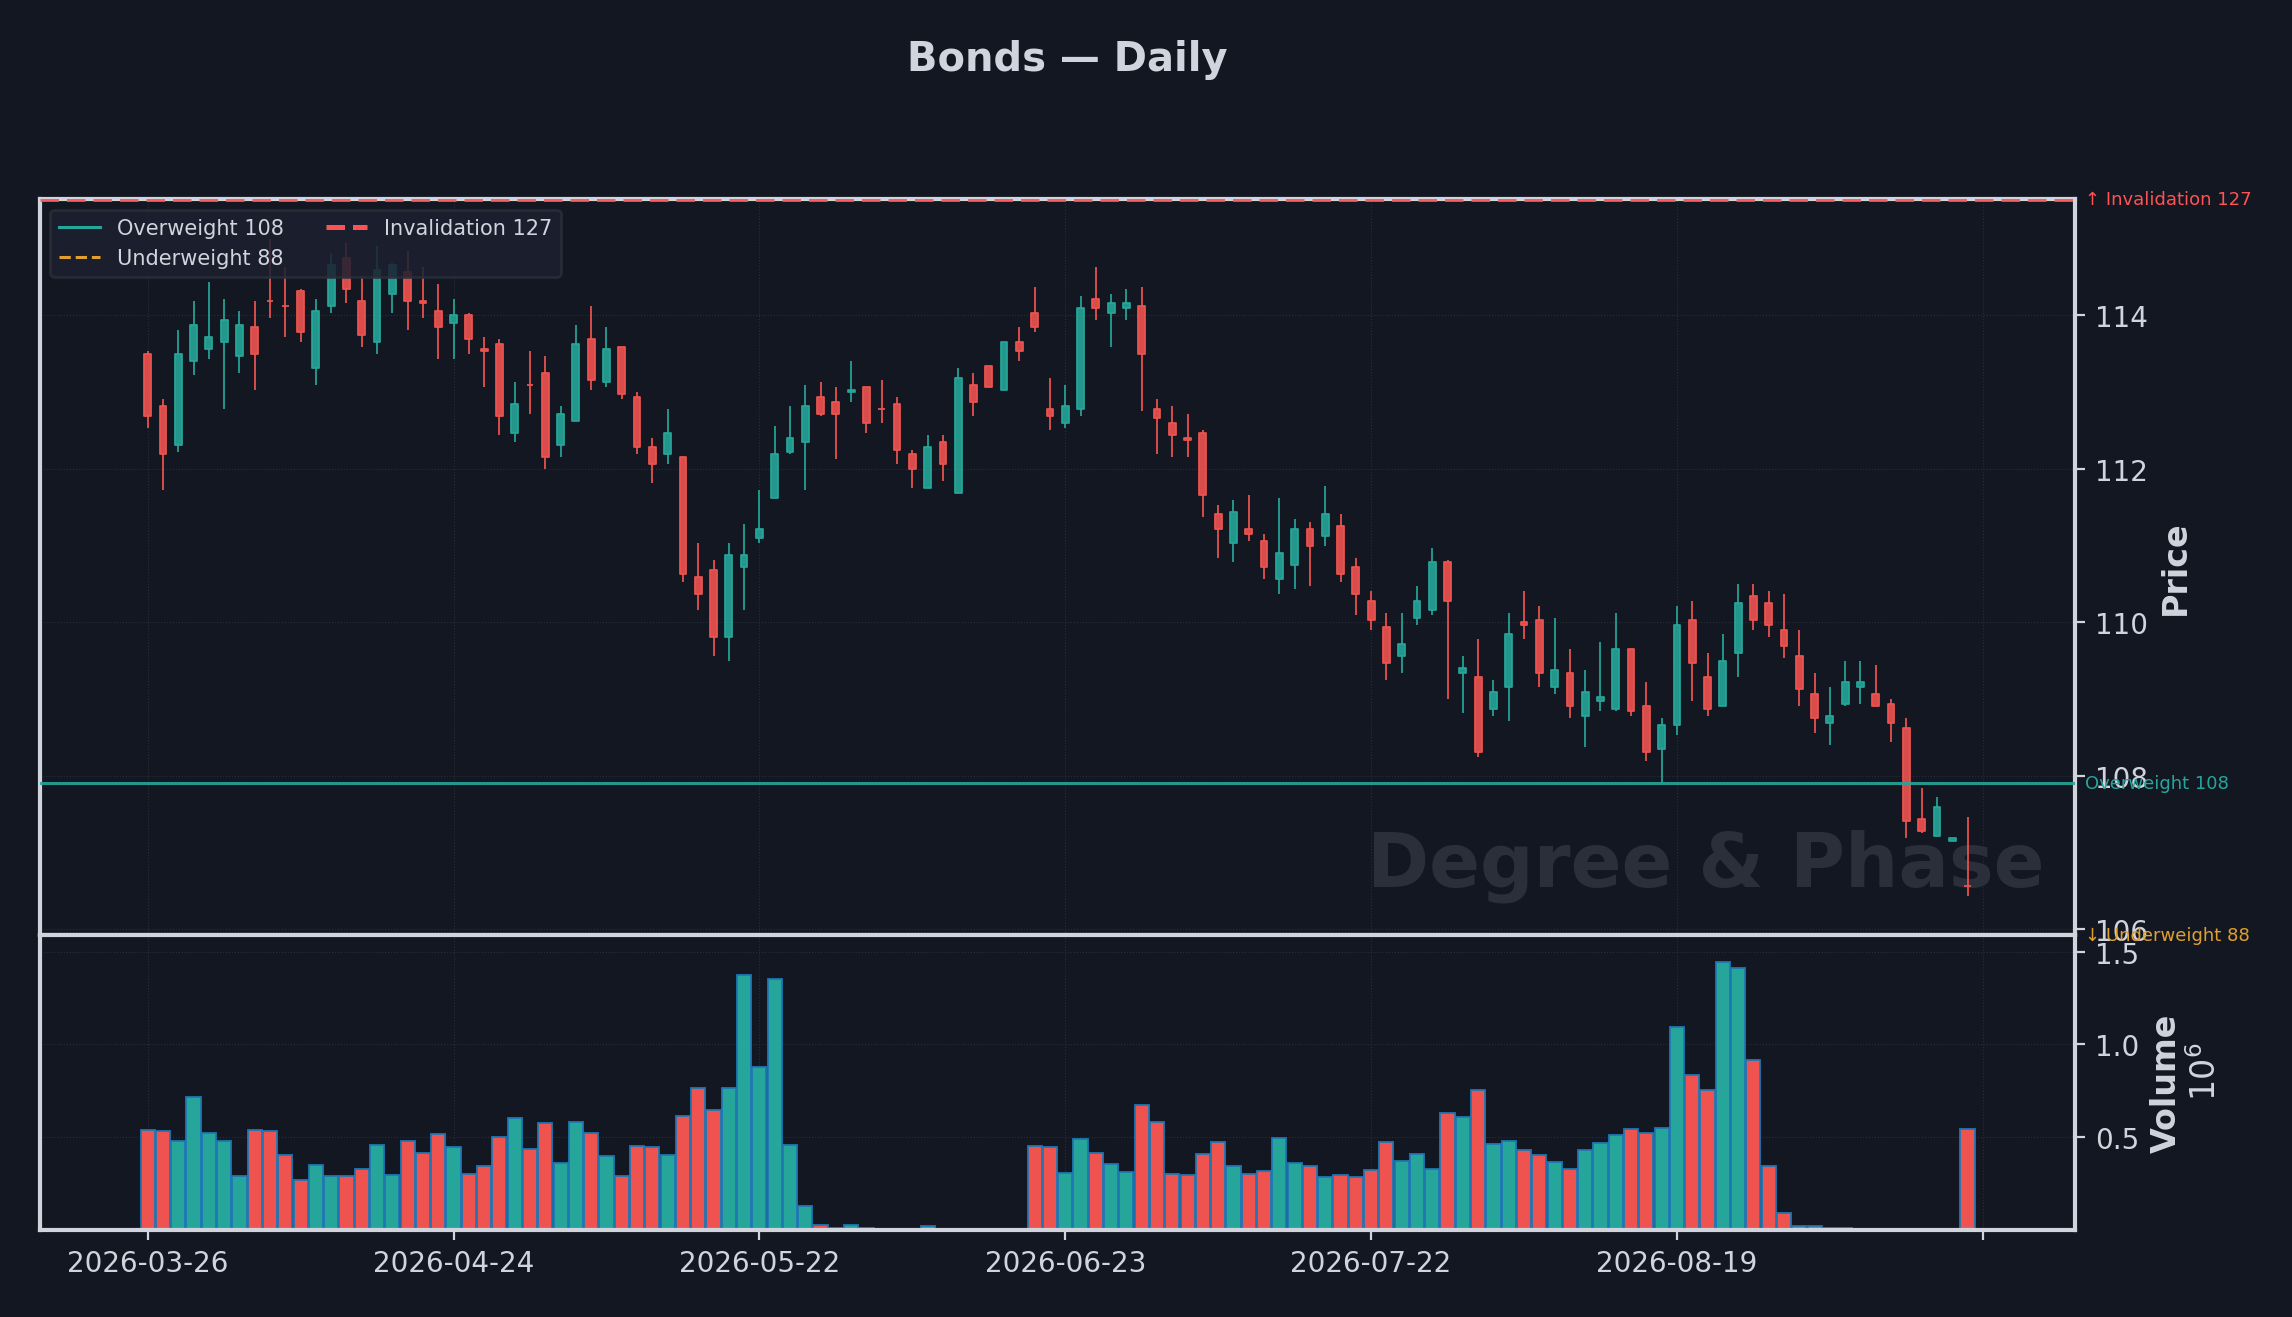
The 40-year bond bull ended in 2020, and the three-year range that followed just failed for good. The floor broke, TLT confirmed it on a weekly close, and this week both futures and cash pushed to fresh multi-year lows (ZB continuous at 104.25, TLT at 79.32). No reclaim, no double bottom. Secular-bear wave 3 is confirmed and extending. The one thing that stops it here is a weekly reclaim of 107.906 on ZB or 82.42 on TLT. Short of that, stay underweight and defensive, and expect real estate to keep taking the same hit.
| Level (30-yr futures) | Price | Means |
|---|---|---|
| Base confirmed | 107.906 | Duration turns; ~5% was the ceiling |
| Secular bear wave 3 | 87.72 | Another leg down; 30-yr toward 6–7% |
What it adds up to
The dollar sits at the center of the board and reads neutral, the driver the rest of the map keys off. U.S. equities read neutral here, a long climb that looks finished rather than fresh. International reads bullish, the cleanest structure on the board and the natural other side of the domestic caution. Gold reads bullish, a secular trend you hold through the noise rather than chase into it. Real estate reads bearish, the laggard that never reclaimed its old peak while the rest ran. Bonds read bearish, a genuine coin flip where duration waits for the range to break one way or the other. Taken together, the year has favored leaning away from the dollar and toward what a softer dollar tends to lift, and nothing in the structure has overturned that yet.
The tells that flip it.
The dollar is the hinge: a weekly reclaim of its upper trigger turns the driver back to dollar-up and trims the case for international and gold, while a break of its lower trigger confirms the decline and lets that rotation run. U.S. equities lose the top-case on a new high above the prior peak, and confirm it only on a decisive break of the shelf beneath. International is the clearest expression of the rotation, so a break of its fifth-wave floor is the tell that the whole thesis has lost its cleanest leg. Gold turns chase-worthy again on a reclaim of its correction high, and warns of another leg down on a loss of its correction low. Real estate cuts its downside case on a weekly hold above its pivot, and deepens it on a break of the shelf below. Bonds turn constructive on a reclaim that confirms the base, and roll into another leg lower on a decisive break of the range floor.
Where these reads come from.
- The Fed's hawkish flip: J.P. Morgan Wealth: a September hike is now expected (Aug 5), and the counter-move: Yahoo Finance: Waller's remark cut hike odds ~63%→50% (Sep 3).
- The oil shock: Al Jazeera: oil rises as Hormuz-reopening hopes fade (Aug 12).
- The dollar's near-term tug: Trading Economics: DXY held ~99 on firmer US jobs (Sep 7).
- Gold: Yahoo Finance: gold eases as hike odds grow; Chair Warsh, CME 66% (Sep 1).
- The long bond: MacroRadar: 30-yr at 5.27%, near a two-decade high (Sep 1).
- The real cost of money: FRED: 10-year real yield (TIPS) 2.42% (Sep 3).
Higher Degree is for members.
The monthly macro read moves behind membership as the site grows. When it opens, membership runs about $100 a month. Join the free list now and you are grandfathered in at a founding rate far below that, locked for as long as you stay a member.
Lock the founding rate. Join free today, and when membership opens at about $100 a month, you pay far less, for good.