Trade setups turn the weekly wave read into specific trades: each one carries a direction, a one-sentence thesis, an entry, a hard stop, five scaled targets, and an honest conviction level. Structure-derived, never gut calls, and every setup shows the price that invalidates it.
What a setup actually looks like.
These are drawn from the Oct 1 cross-validation: real levels, shown to illustrate the format. The honest headline first: there is no high-conviction index setup. NQ and QQQ are 40/34 coin flips, so the conviction lives in single names. Every setup carries the same anatomy: direction, thesis in a sentence, the exact levels, and how much conviction the structure earns. Educational and illustrative only. See the disclaimer at the foot of the page.
Sell the failed bounce Oct 1
Chart · Oct 1 daily →
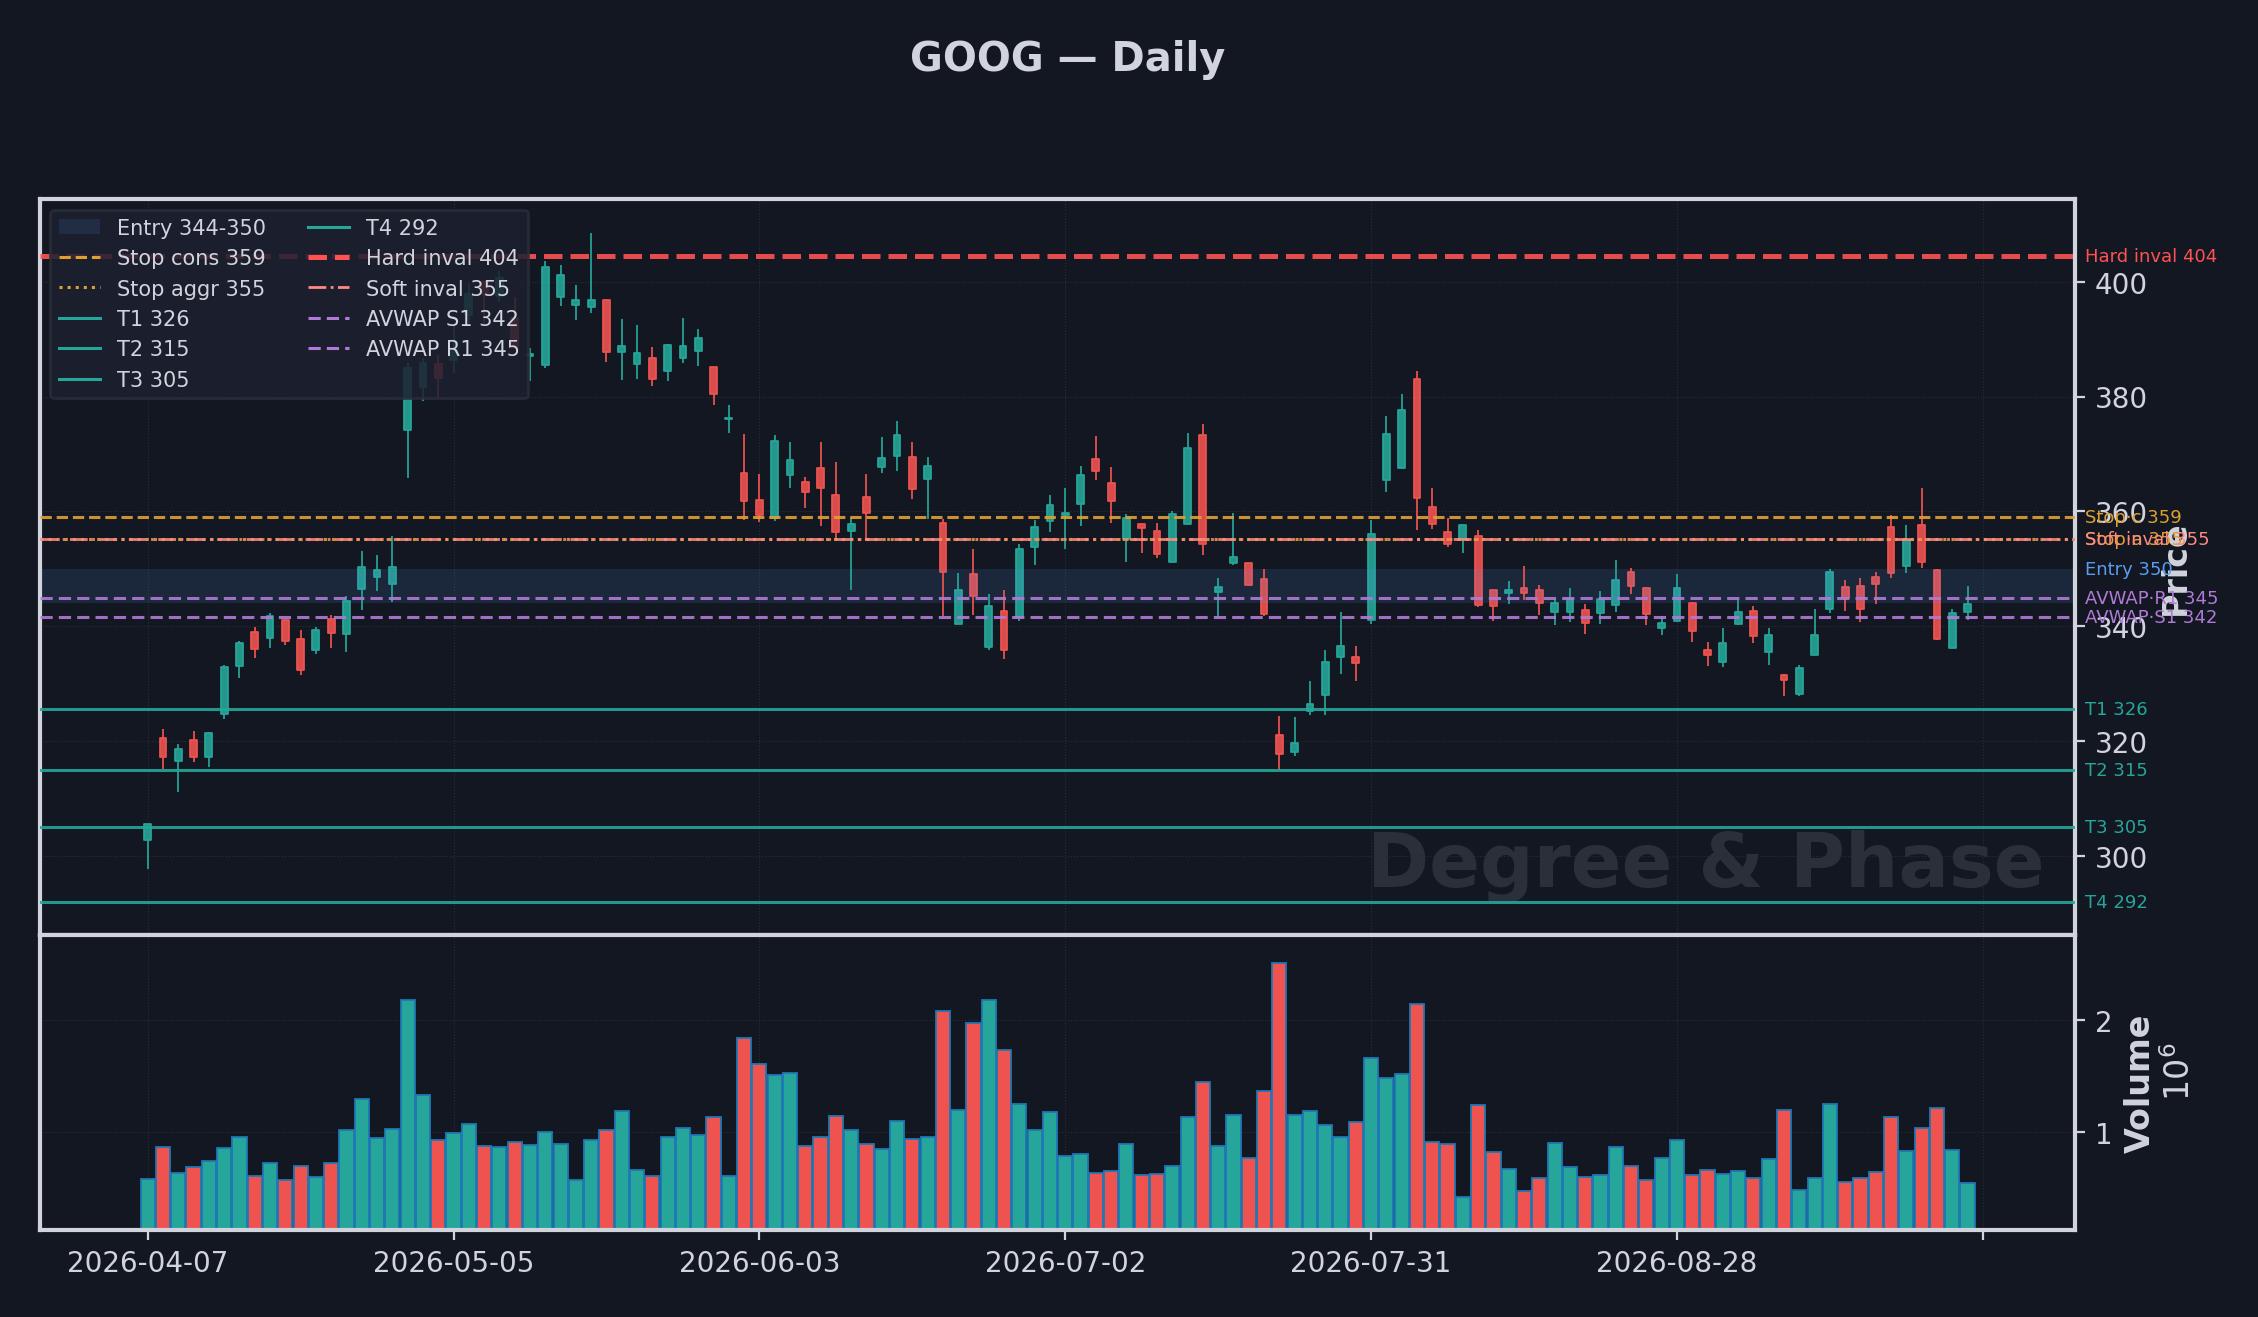
The read here stays bearish while price holds under 404.44, and losing that line on a closing basis is the only thing that voids it. The decline already printed a fresh low at 336.00, breaking the base that had held, and the corrective bounce back into the 344.00 to 350.00 zone failed, which is exactly where sellers keep leaning with risk defined just beyond 358.99. A lower leg is still owed, so the measured path carries first toward 325.63, then 314.90, and deeper toward 305.00, then 292.00 while that line holds. The anchored 341.55 and 344.91 mark the levels a recovery would have to take back before any of this is in doubt. Let the level come to you, and respect the invalidation rather than arguing with it.
Ride the breakout Oct 1
Chart · Oct 1 daily →
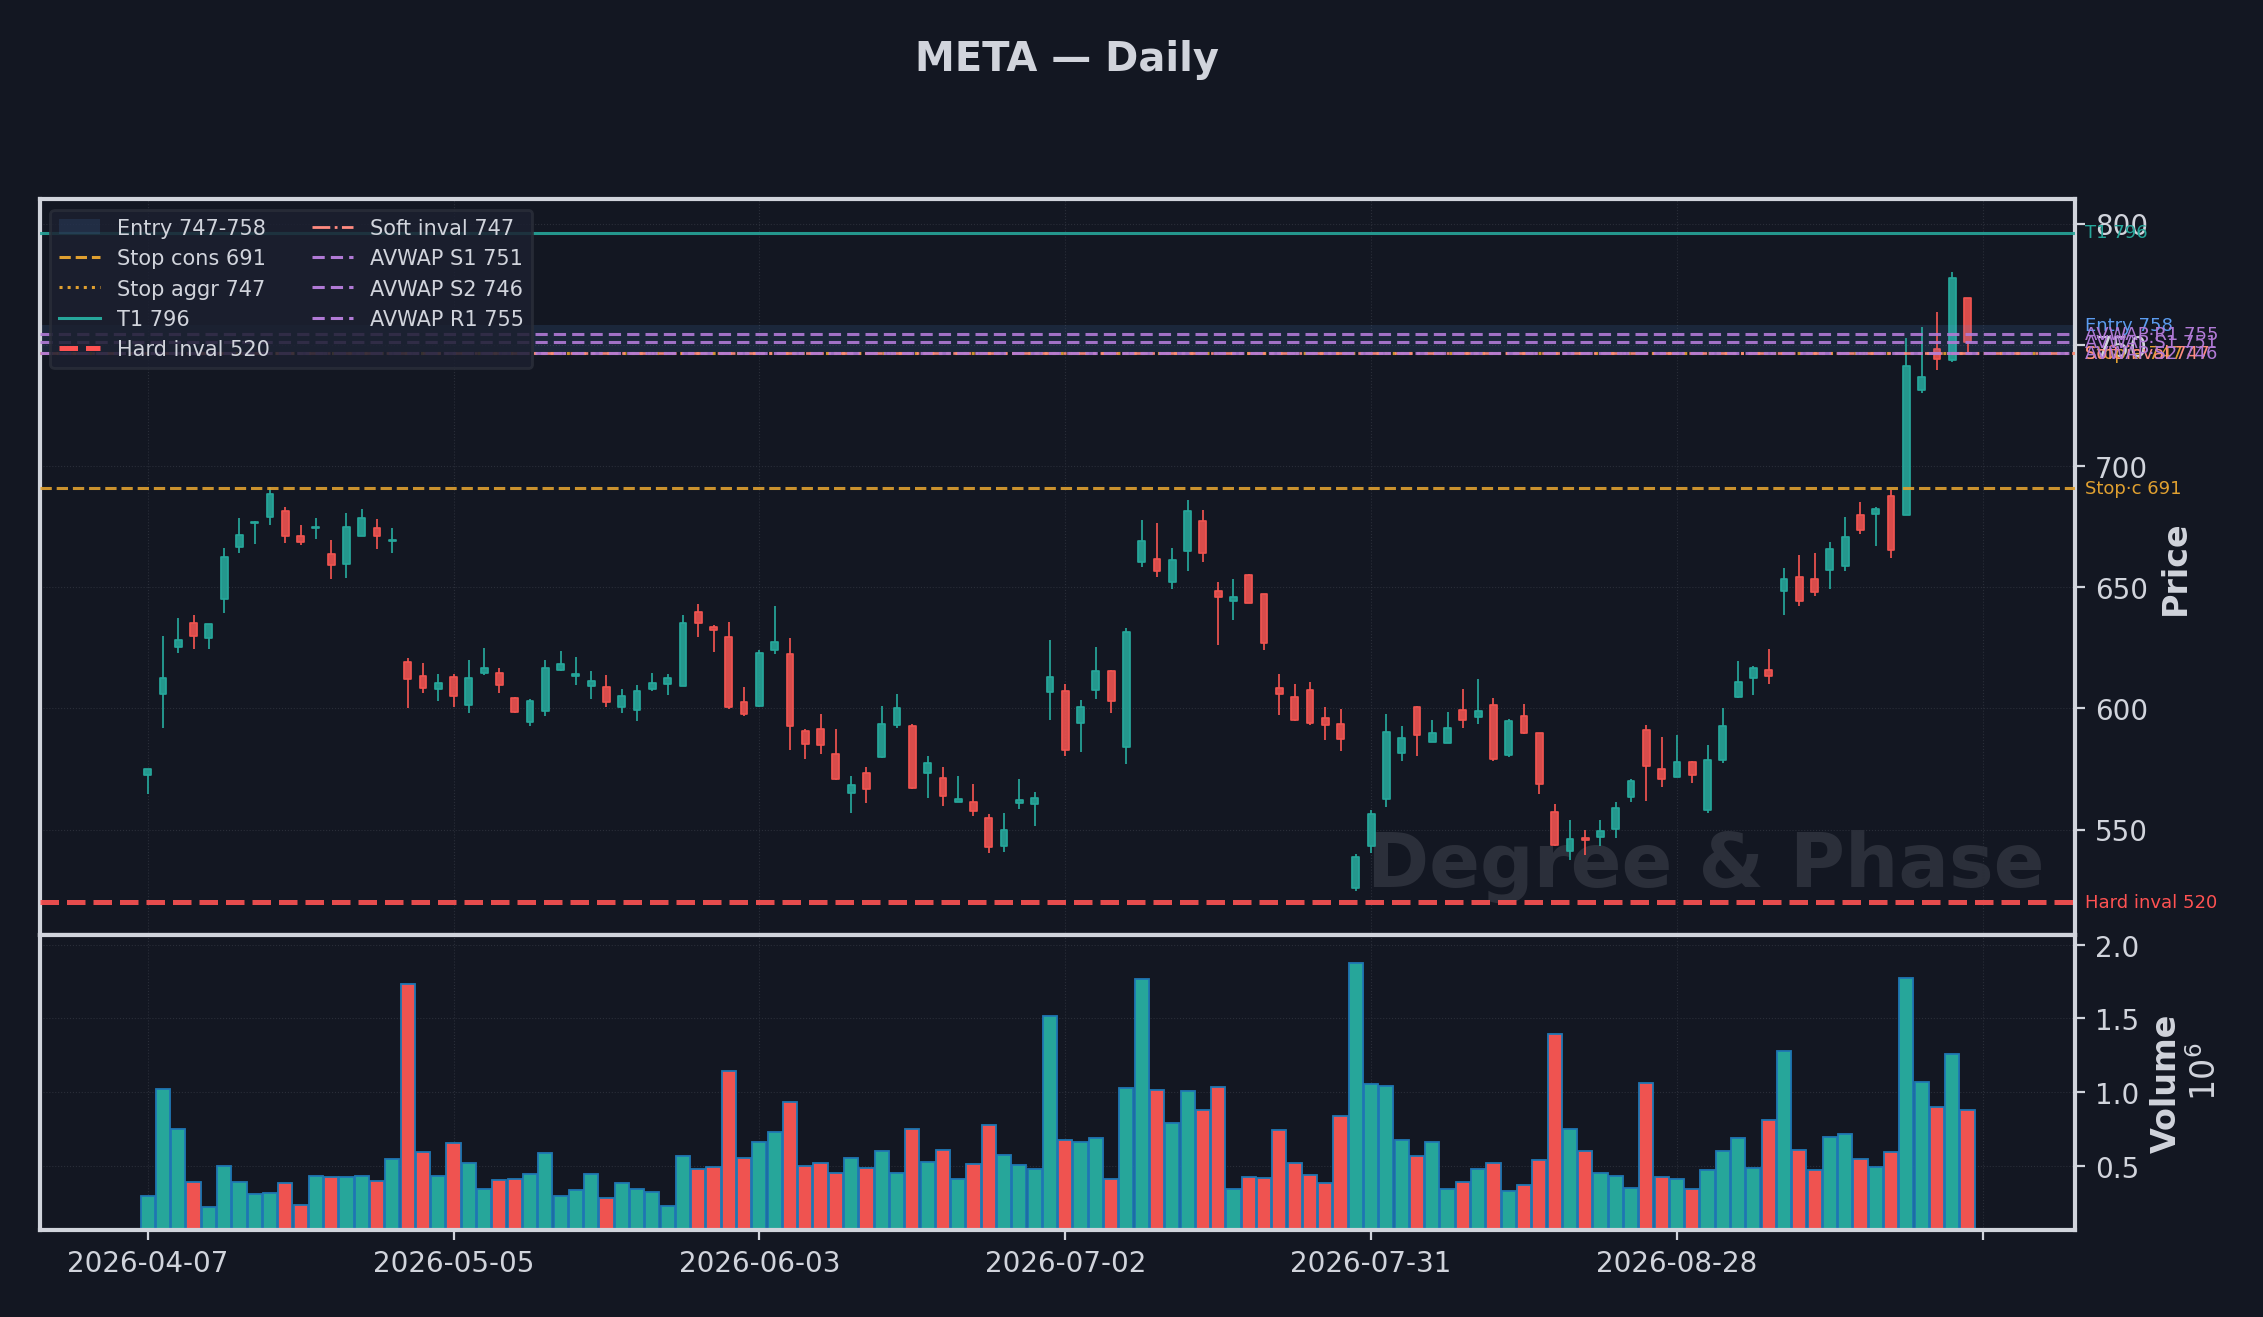
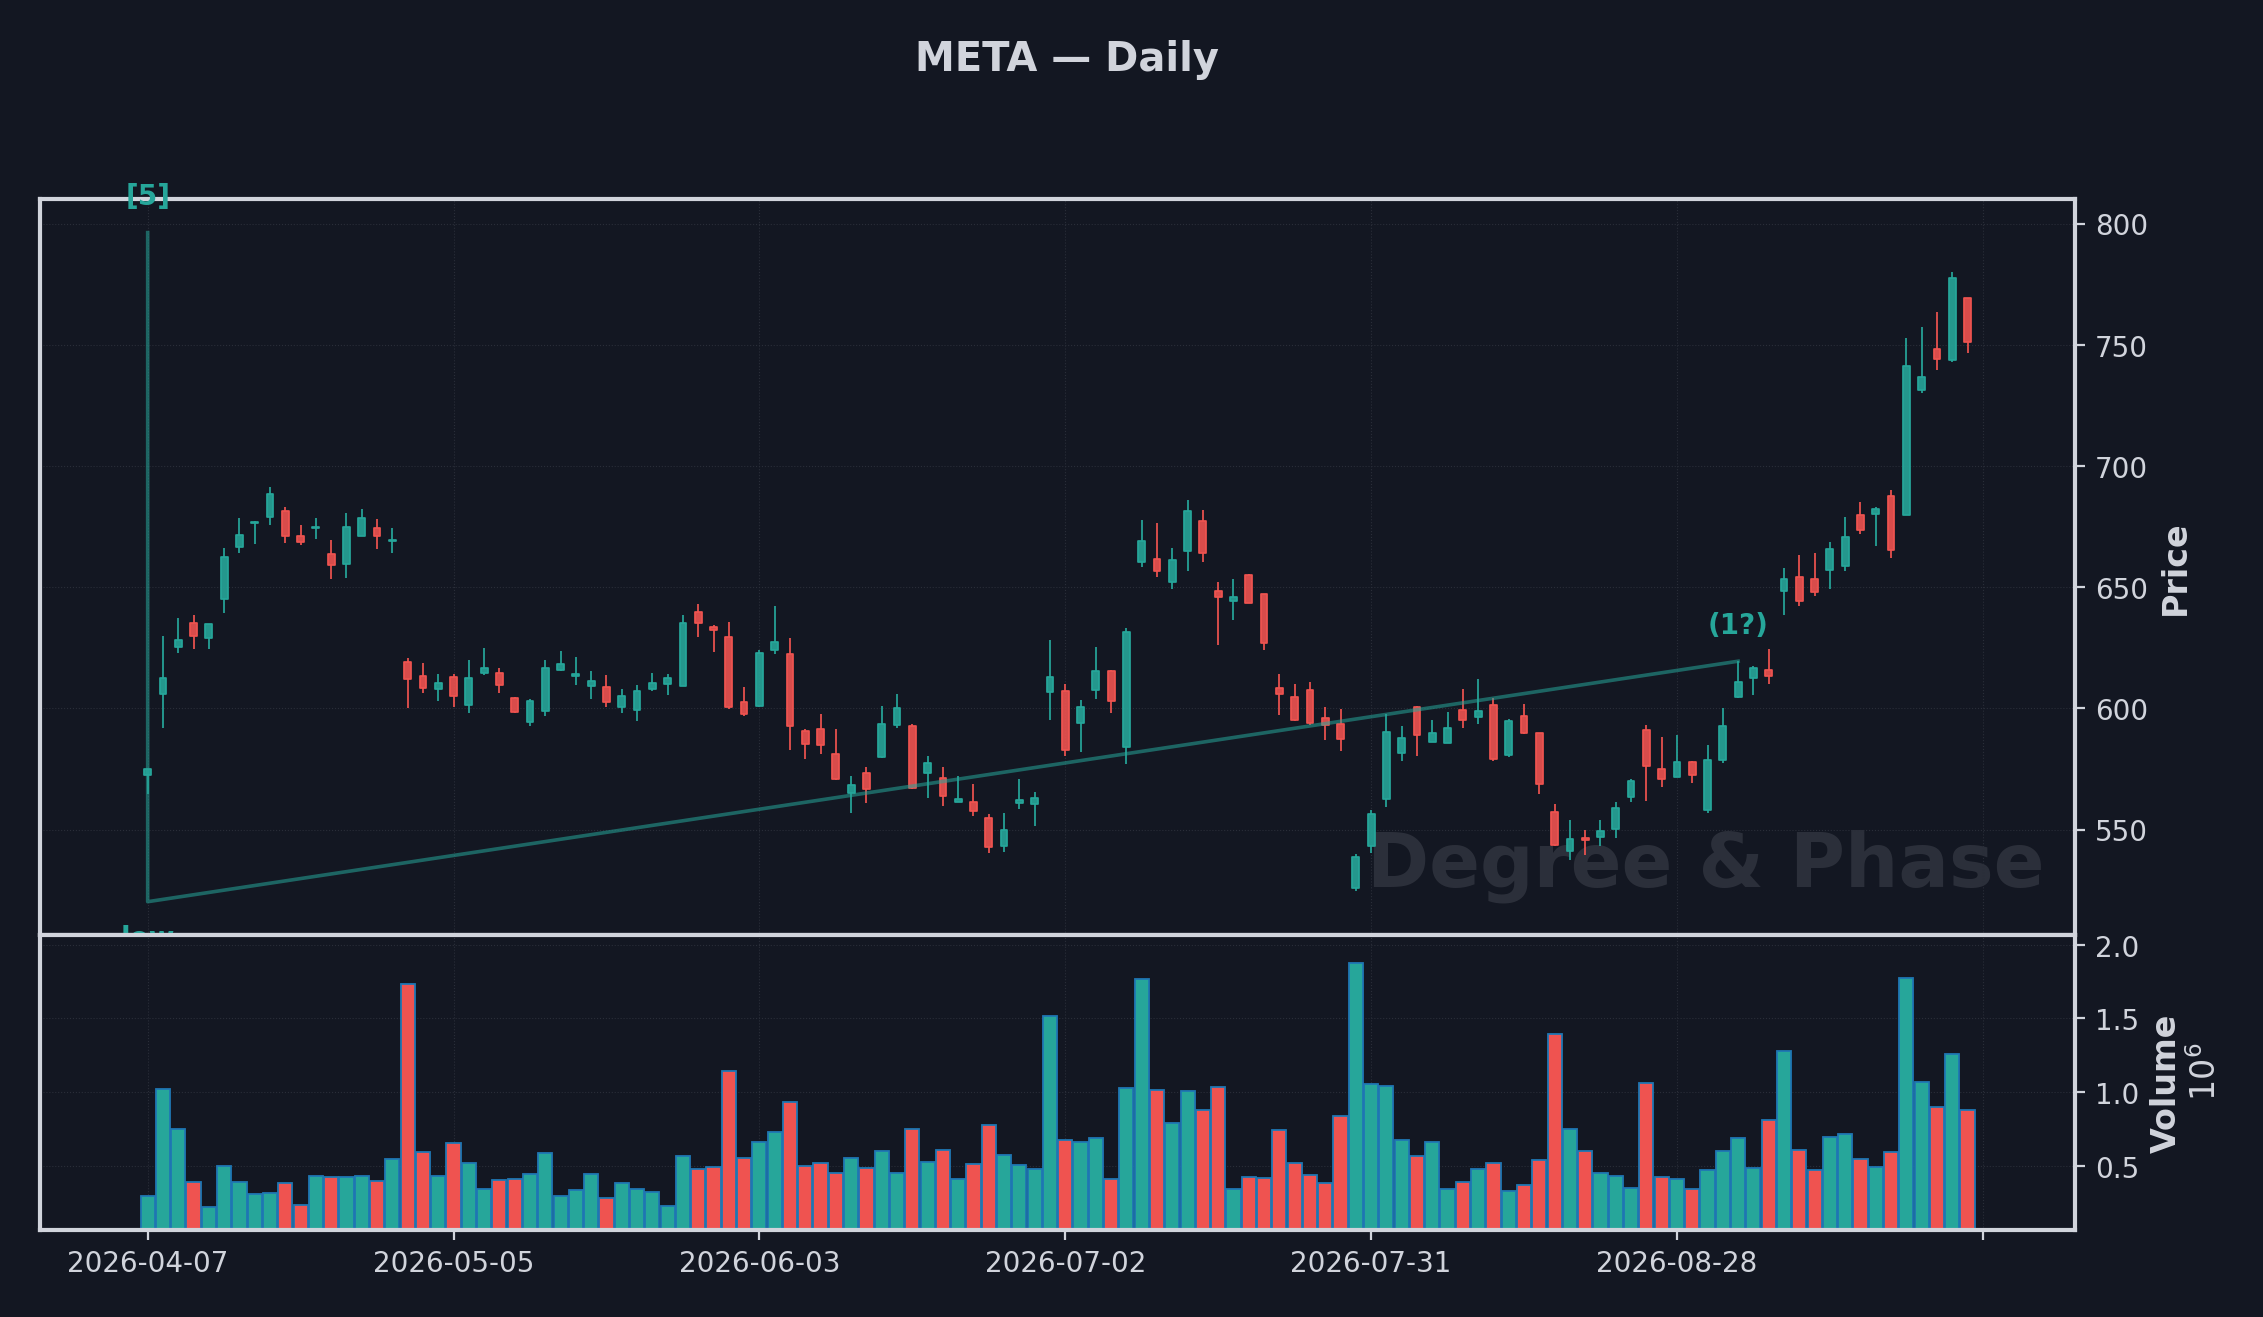
The read here stays bullish while price holds above 520.26, and losing that line on a closing basis is the only thing that voids it. Buyers already reclaimed the trigger at 780.50, and the pullback into the 747.00 to 758.00 zone is where they keep stepping in, with risk defined just beyond 691.00. A higher leg is still owed, so the measured path carries first toward 796.25 while that line holds. The anchored 750.93 and 754.54 mark the levels a recovery would have to take back before any of this is in doubt. Let the level come to you, and respect the invalidation rather than arguing with it.
New-high continuation Oct 1
Chart · Oct 1 daily →
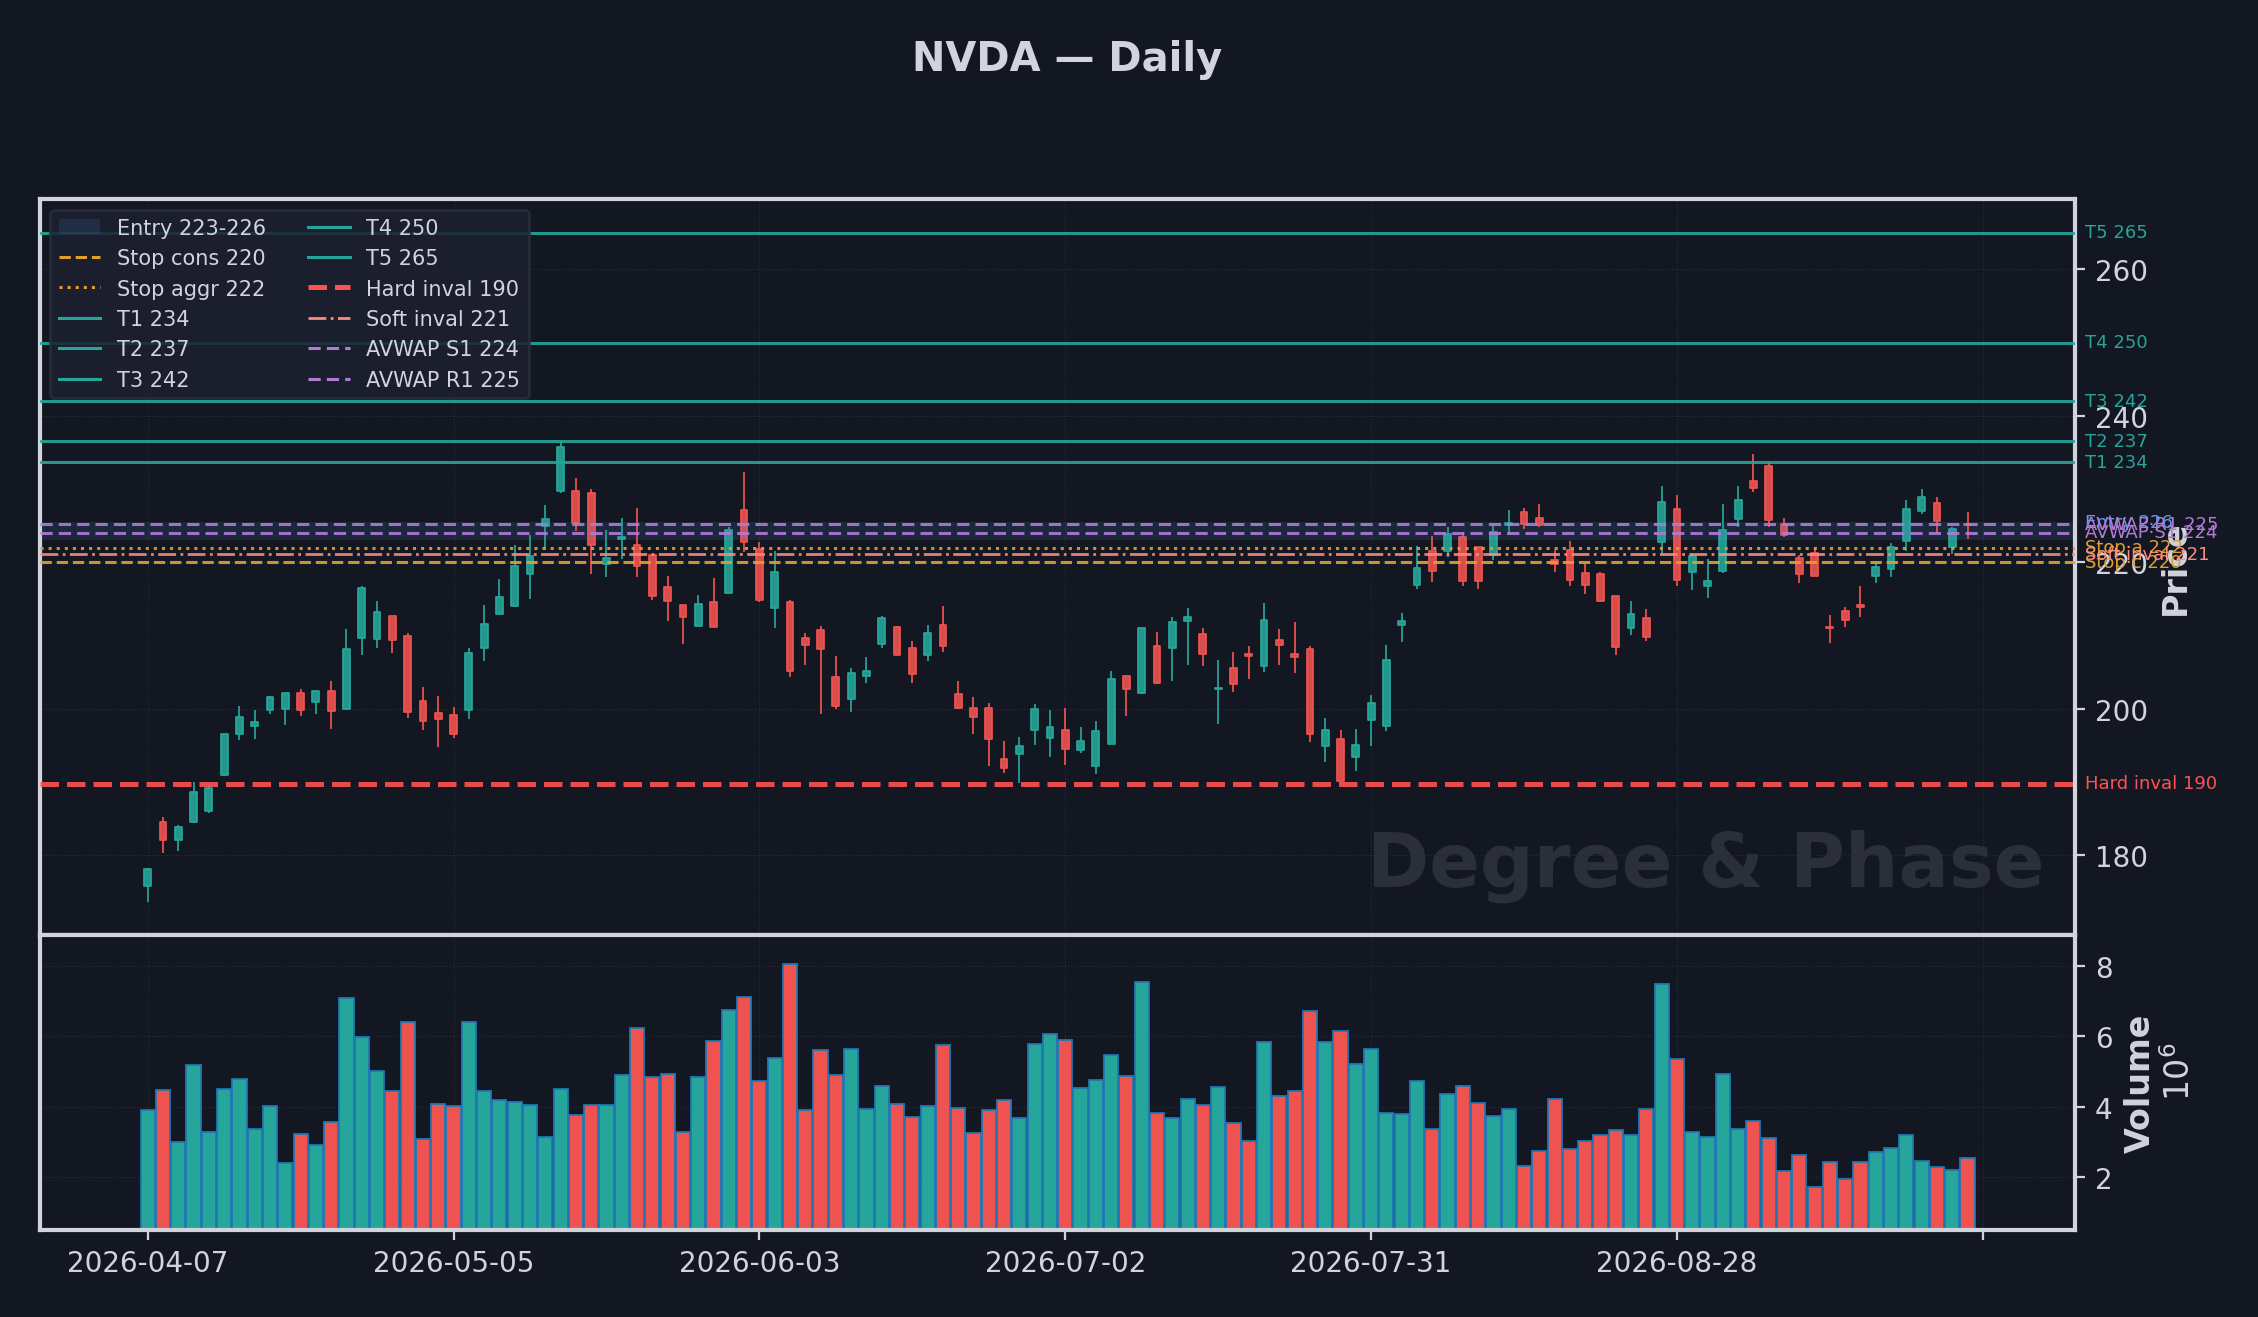
The read here stays bullish while price holds above 189.80, and losing that line on a closing basis is the only thing that voids it. Buyers already reclaimed the trigger at 230.00, and the pullback into the 223.00 to 225.50 zone is where they keep stepping in, with risk defined just beyond 220.00. A higher leg is still owed, so the measured path carries first toward 233.71, then 236.54, and deeper toward 242.00, then 250.00 while that line holds. The anchored 224.06 and 225.19 mark the levels a recovery would have to take back before any of this is in doubt. Let the level come to you, and respect the invalidation rather than arguing with it.
Buy the dip (bull lean) Oct 1
Chart · Oct 1 daily →
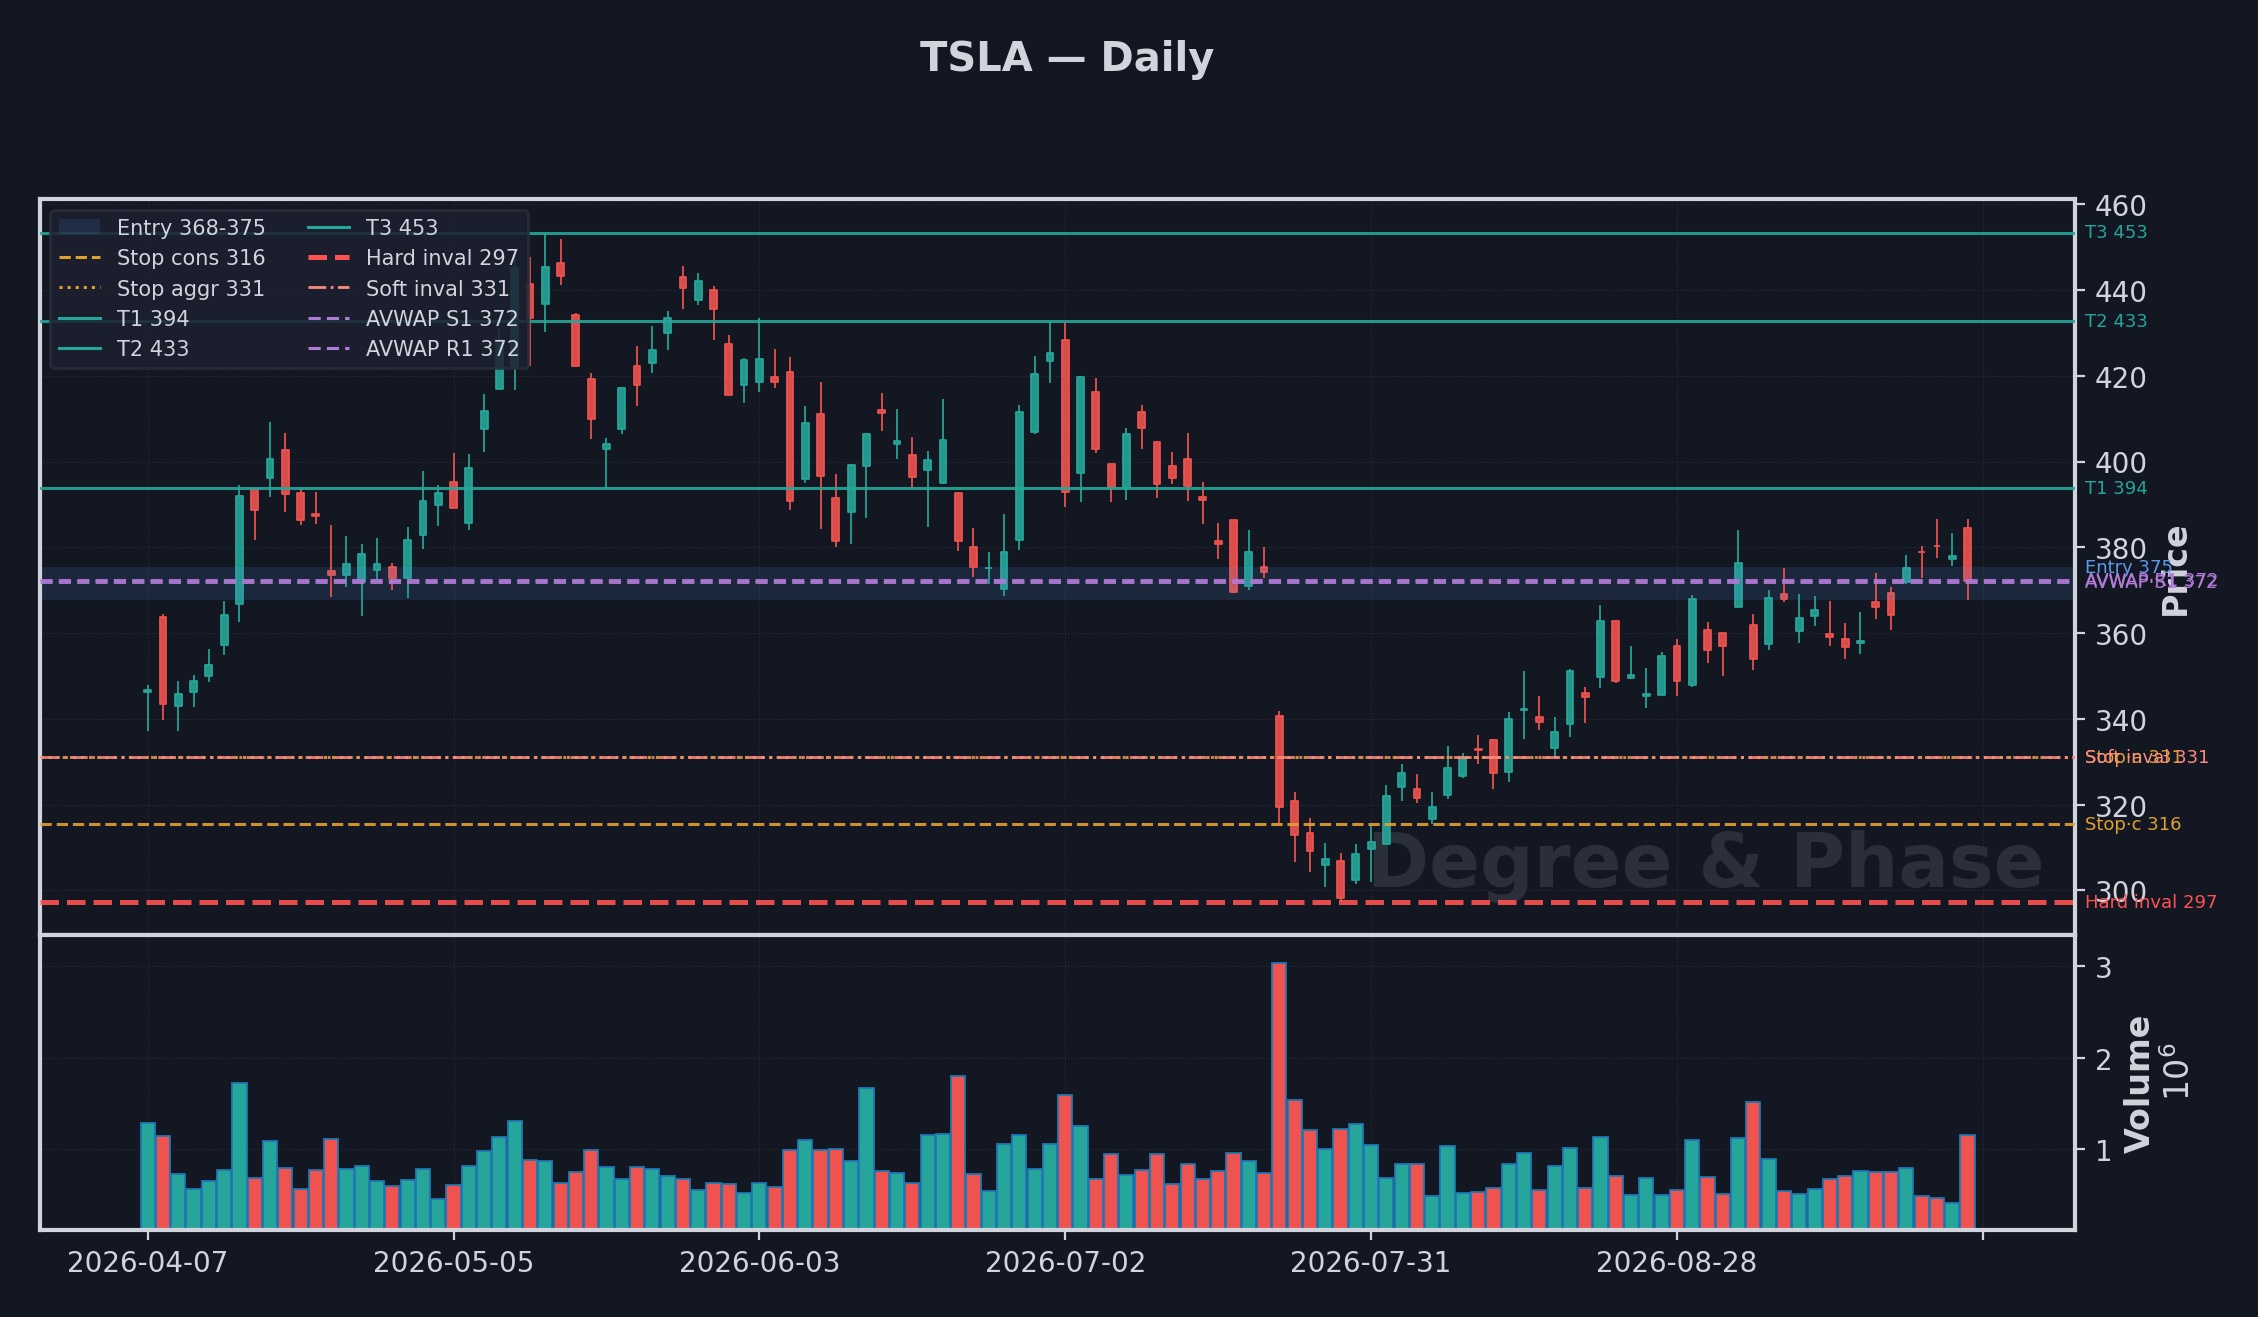
The read here stays bullish while price holds above 297.38, and losing that line on a closing basis is the only thing that voids it. Buyers already reclaimed the trigger at 384.04, and the pullback into the 367.74 to 375.43 zone is where they keep stepping in, with risk defined just beyond 315.50. A higher leg is still owed, so the measured path carries first toward 393.80, then 432.85, and deeper toward 453.40 while that line holds. The anchored 371.93 and 372.36 mark the levels a recovery would have to take back before any of this is in doubt. Let the level come to you, and respect the invalidation rather than arguing with it.
Third-wave advance Oct 1
Chart · Oct 1 daily →
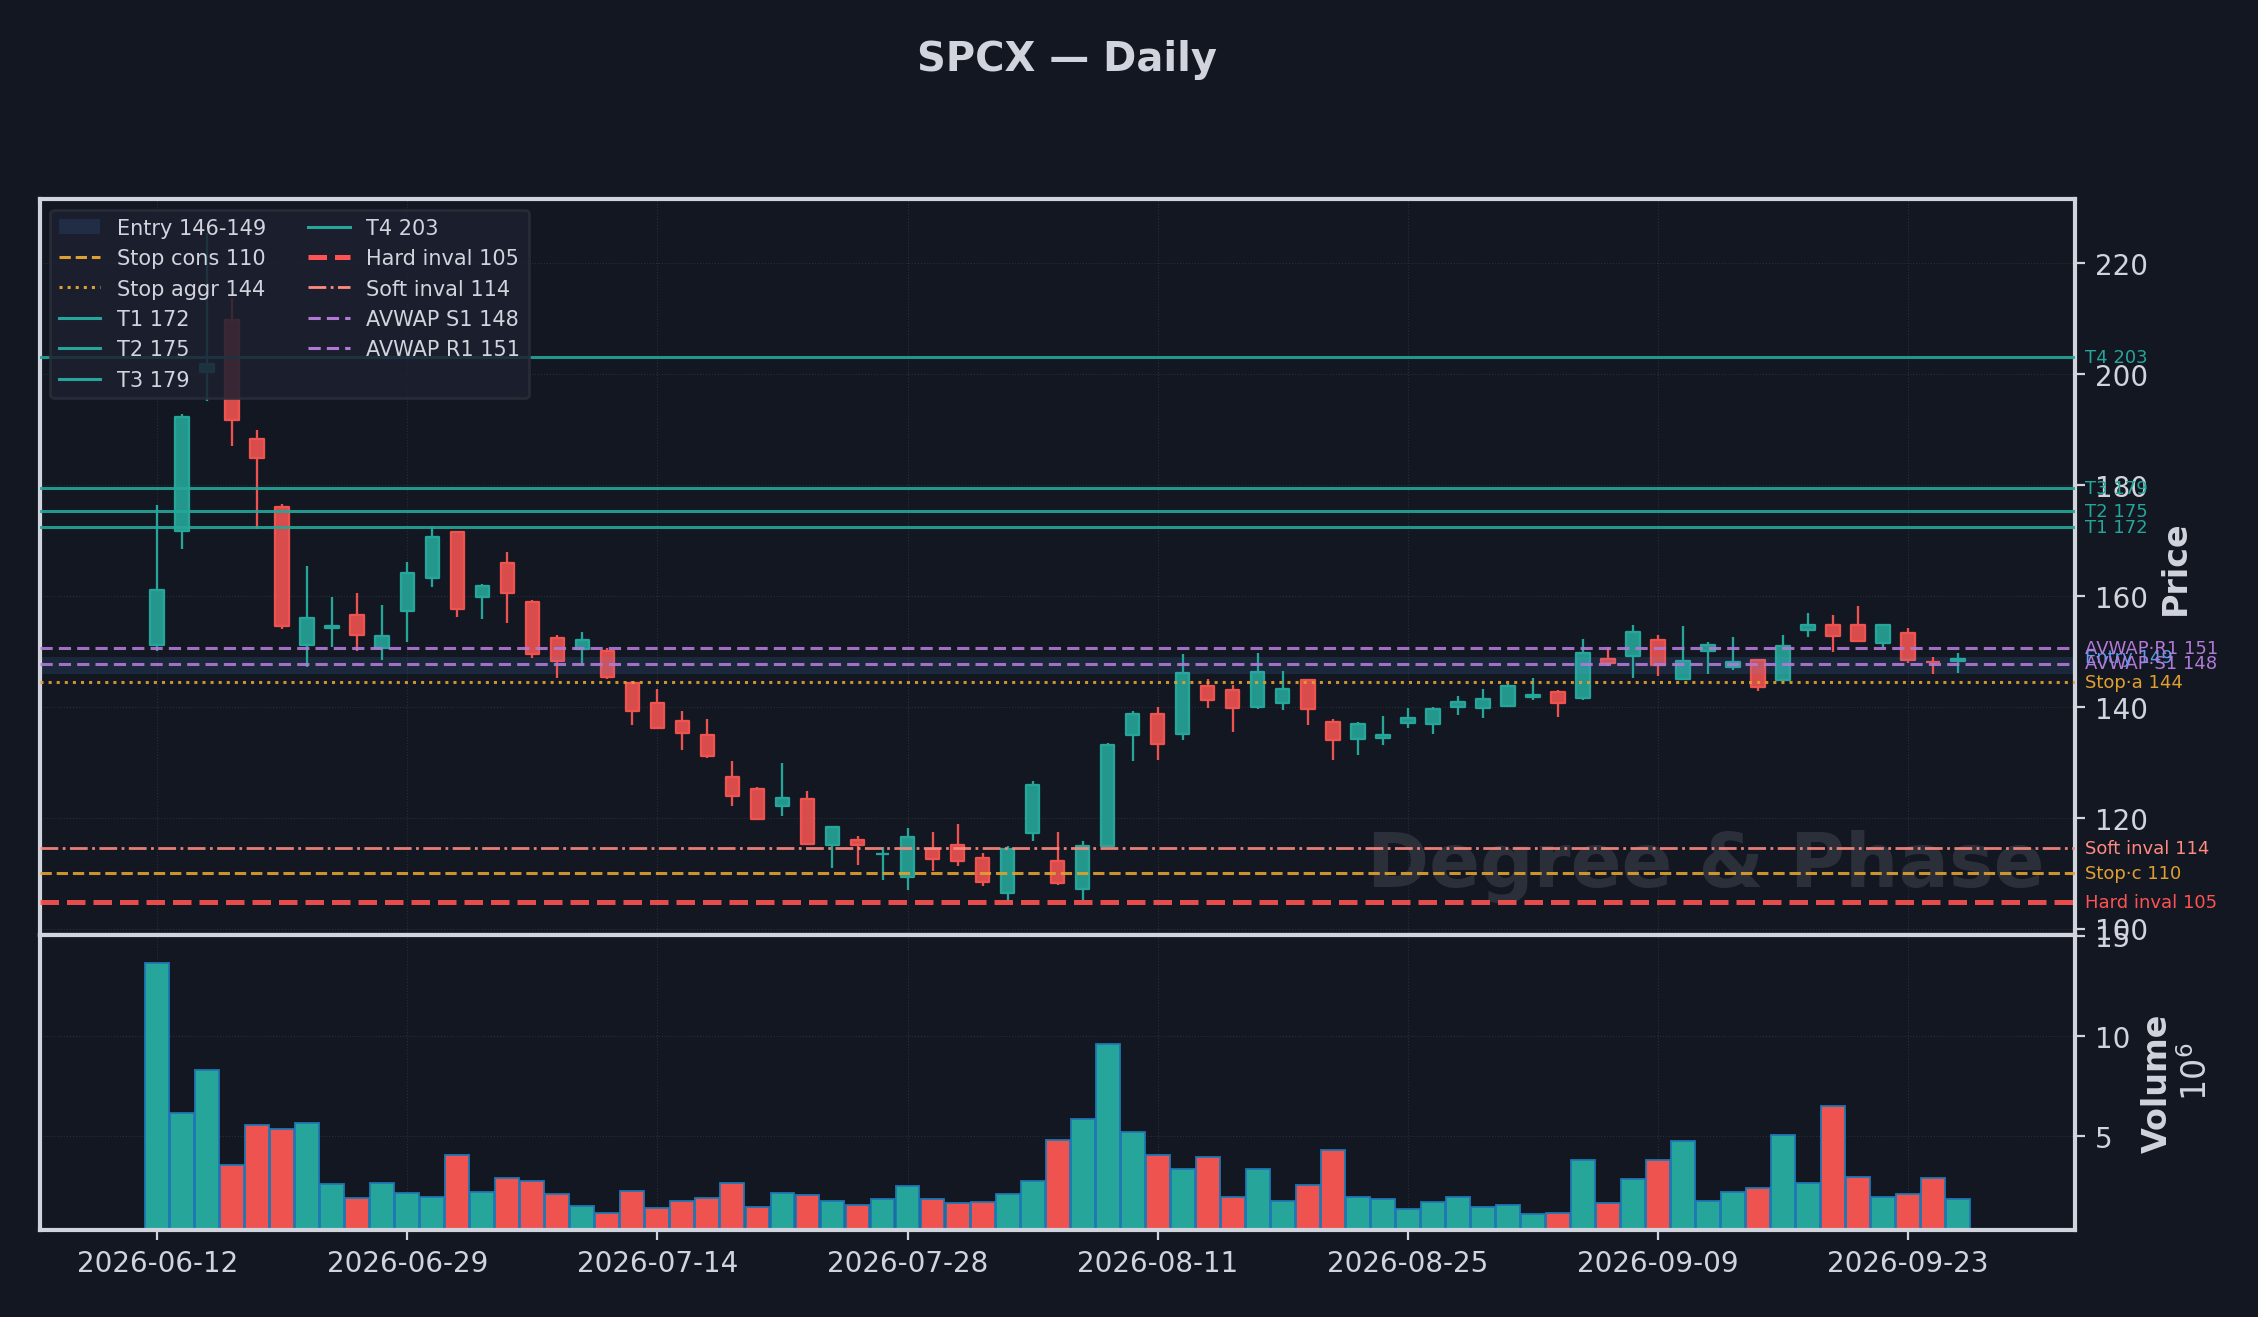
The read here stays bullish while price holds above 104.85, and losing that line on a closing basis is the only thing that voids it. Buyers already reclaimed the trigger at 158.20, and the pullback into the 146.00 to 149.00 zone is where they keep stepping in, with risk defined just beyond 110.00. A higher leg is still owed, so the measured path carries first toward 172.39, then 175.35, and deeper toward 179.48, then 203.13 while that line holds. The anchored 147.80 and 150.63 mark the levels a recovery would have to take back before any of this is in doubt. Let the level come to you, and respect the invalidation rather than arguing with it.
Short the bounce (bear lean) Oct 1
The read here stays bullish while price holds above 27493.50, and losing that line on a closing basis is the only thing that voids it. Buyers already reclaimed the trigger at 31151.50, and the pullback into the 30529.25 to 30633.25 zone is where they keep stepping in, with risk defined just beyond 29042.50. A higher leg is still owed, so the measured path carries first toward 31269.00, then 31398.00, and deeper toward 32192.00 while that line holds. The anchored 30484.98 marks the level a recovery would have to take back before any of this is in doubt. Let the level come to you, and respect the invalidation rather than arguing with it.
The index mirror: no trade Oct 1
Chart · Oct 1 daily →
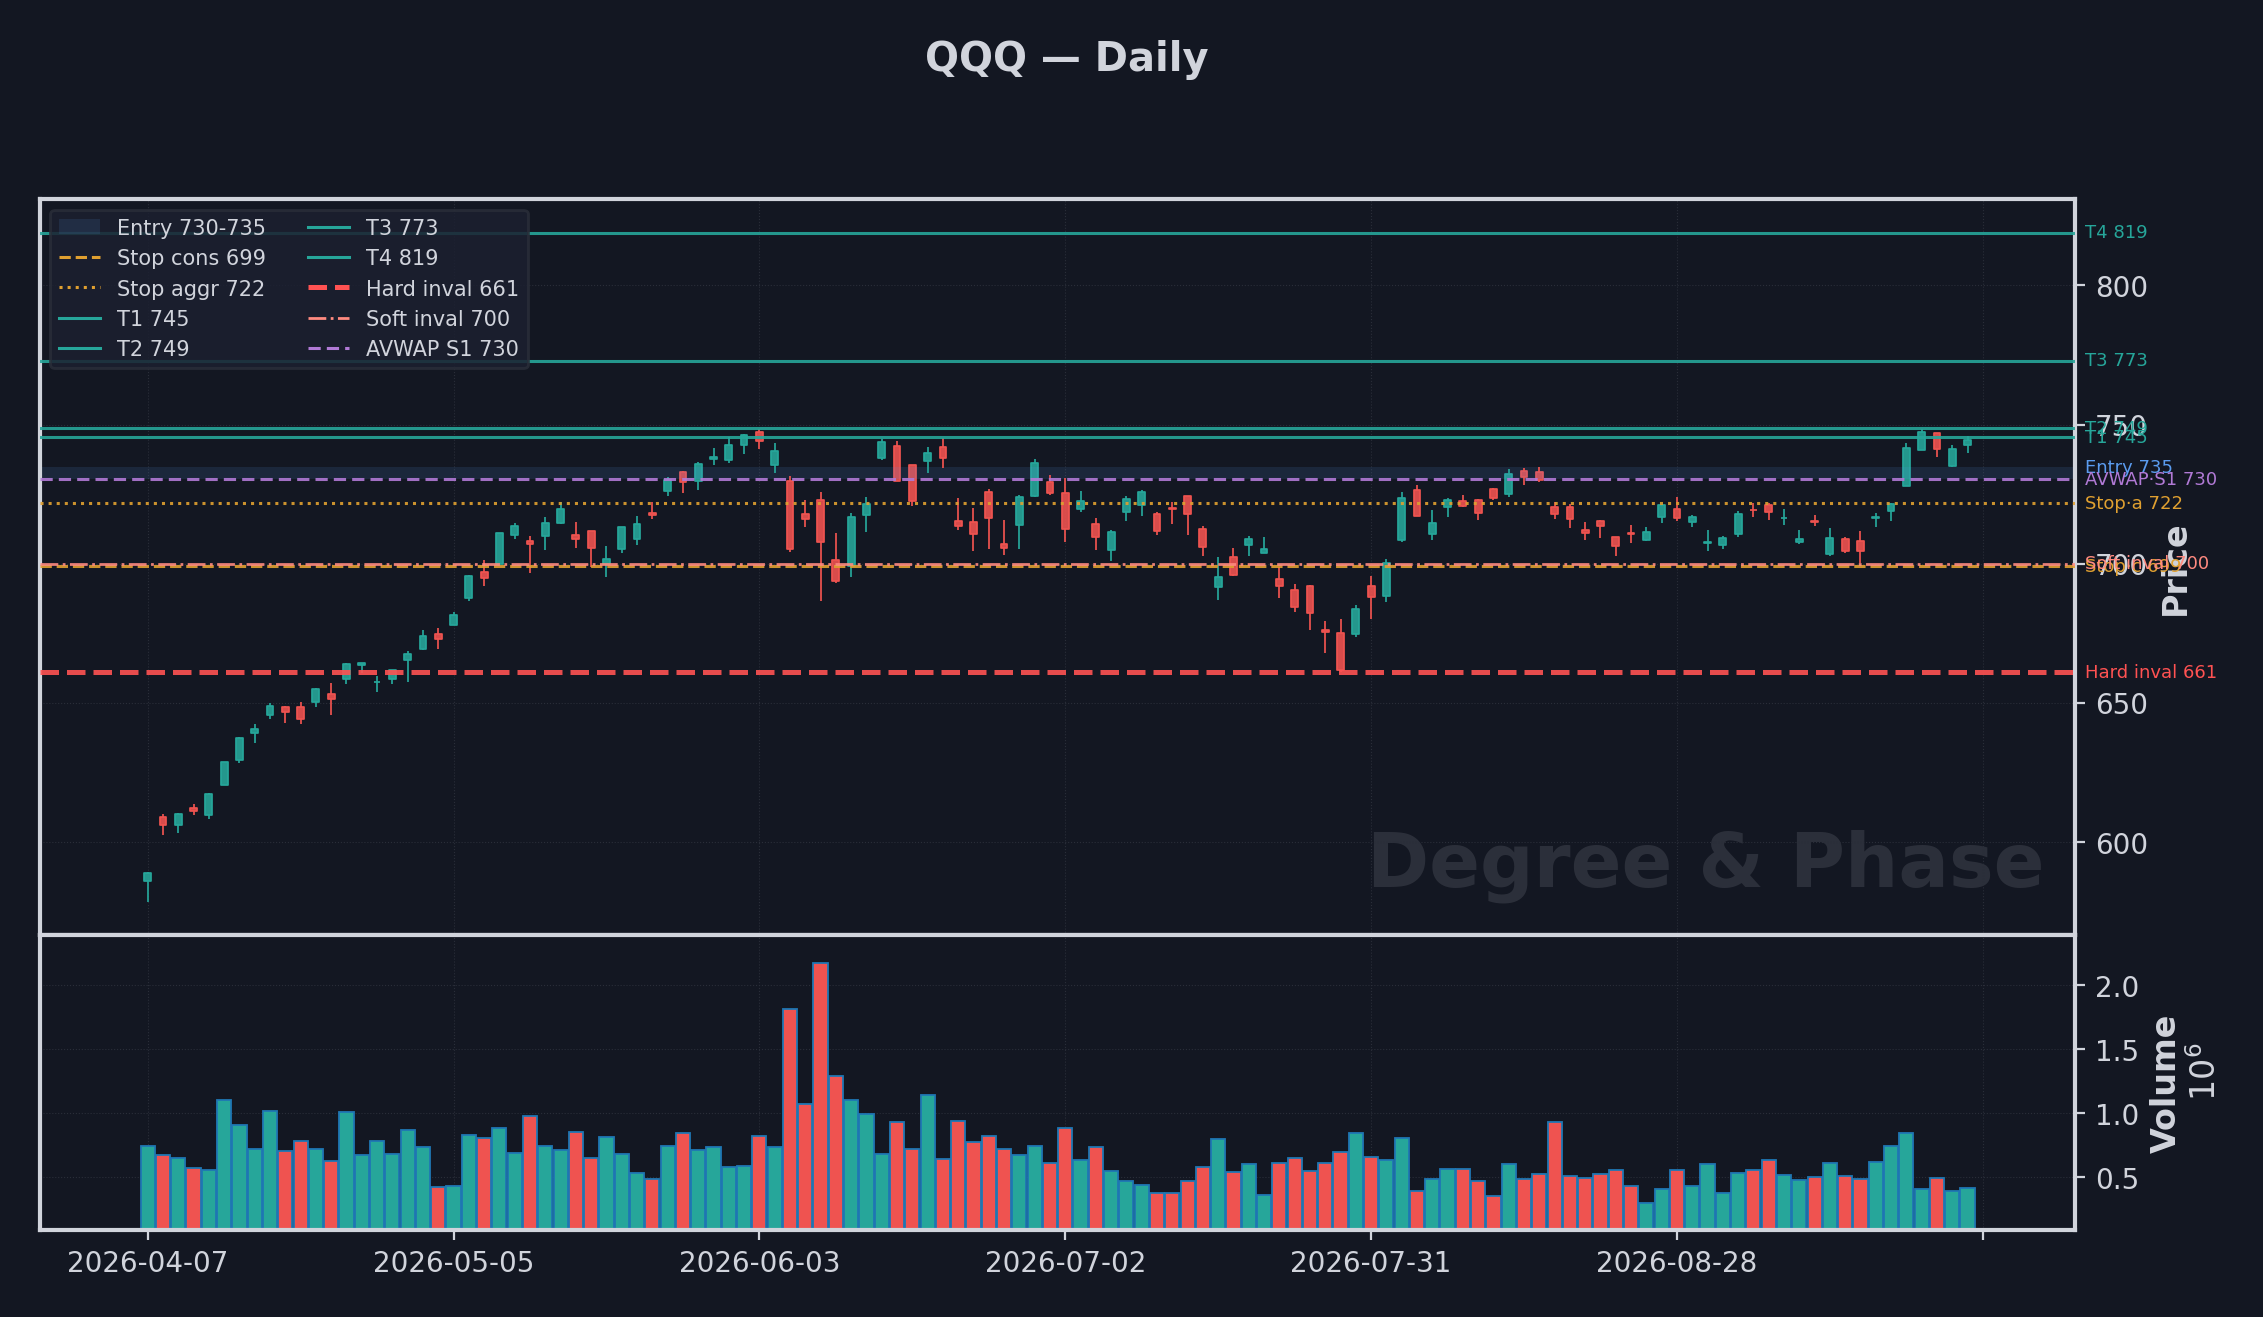
The read here stays bullish while price holds above 661.14, and losing that line on a closing basis is the only thing that voids it. Buyers keep defending the 730.33 to 734.58 zone, with risk defined just beyond 699.00, waiting on the break that confirms the next leg higher. A higher leg is still owed, so the measured path carries first toward 745.45, then 748.65, and deeper toward 773.00, then 819.00 while that line holds. The anchored 730.33 marks the level a recovery would have to take back before any of this is in doubt. Let the level come to you, and respect the invalidation rather than arguing with it.
Why the numbers aren't arbitrary.
Every level on a setup card traces back to something. The entry sits where a wave completes or an anchored VWAP lines up. The stop sits at the price that would invalidate the count: cross it and the thesis is objectively dead, so you're out, no debate. The targets are the measured moves and Fibonacci projections the structure implies, scaled T1 through T5 so you bank profit on the way instead of hoping for the home run.
The conviction dots are the honest part. Three tools agreeing (Elliott, Wyckoff, and AVWAP all pointing the same way) earns a high number. One tool leading and the others neutral earns a low one. A low-conviction setup isn't a bad trade; it's a small one. That distinction is the whole game.
Live context.
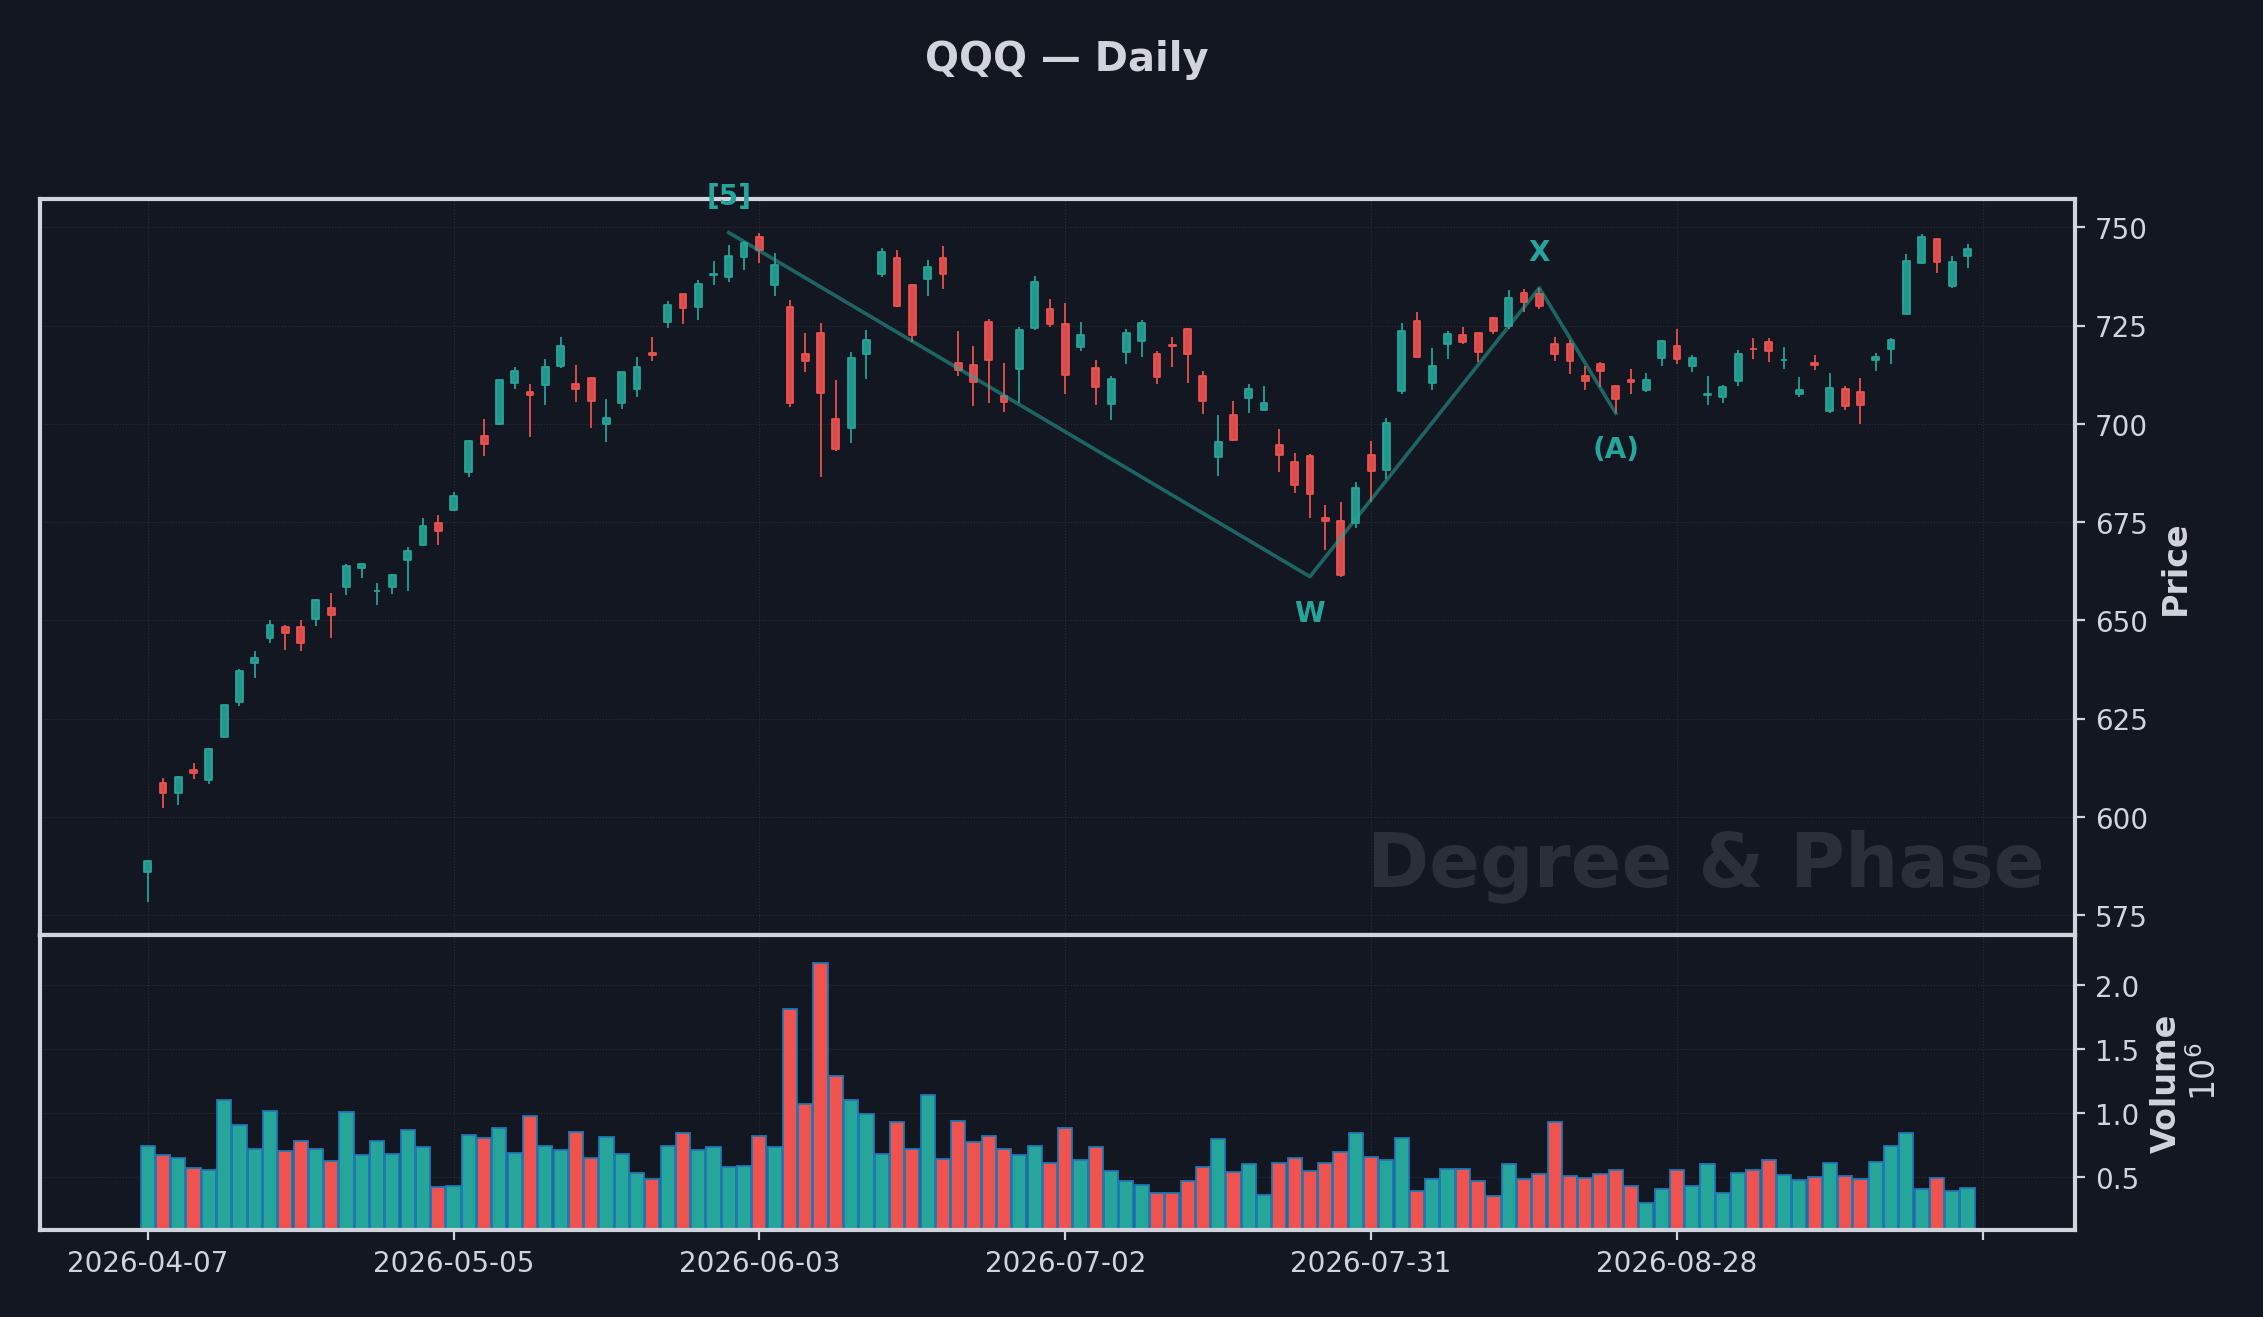
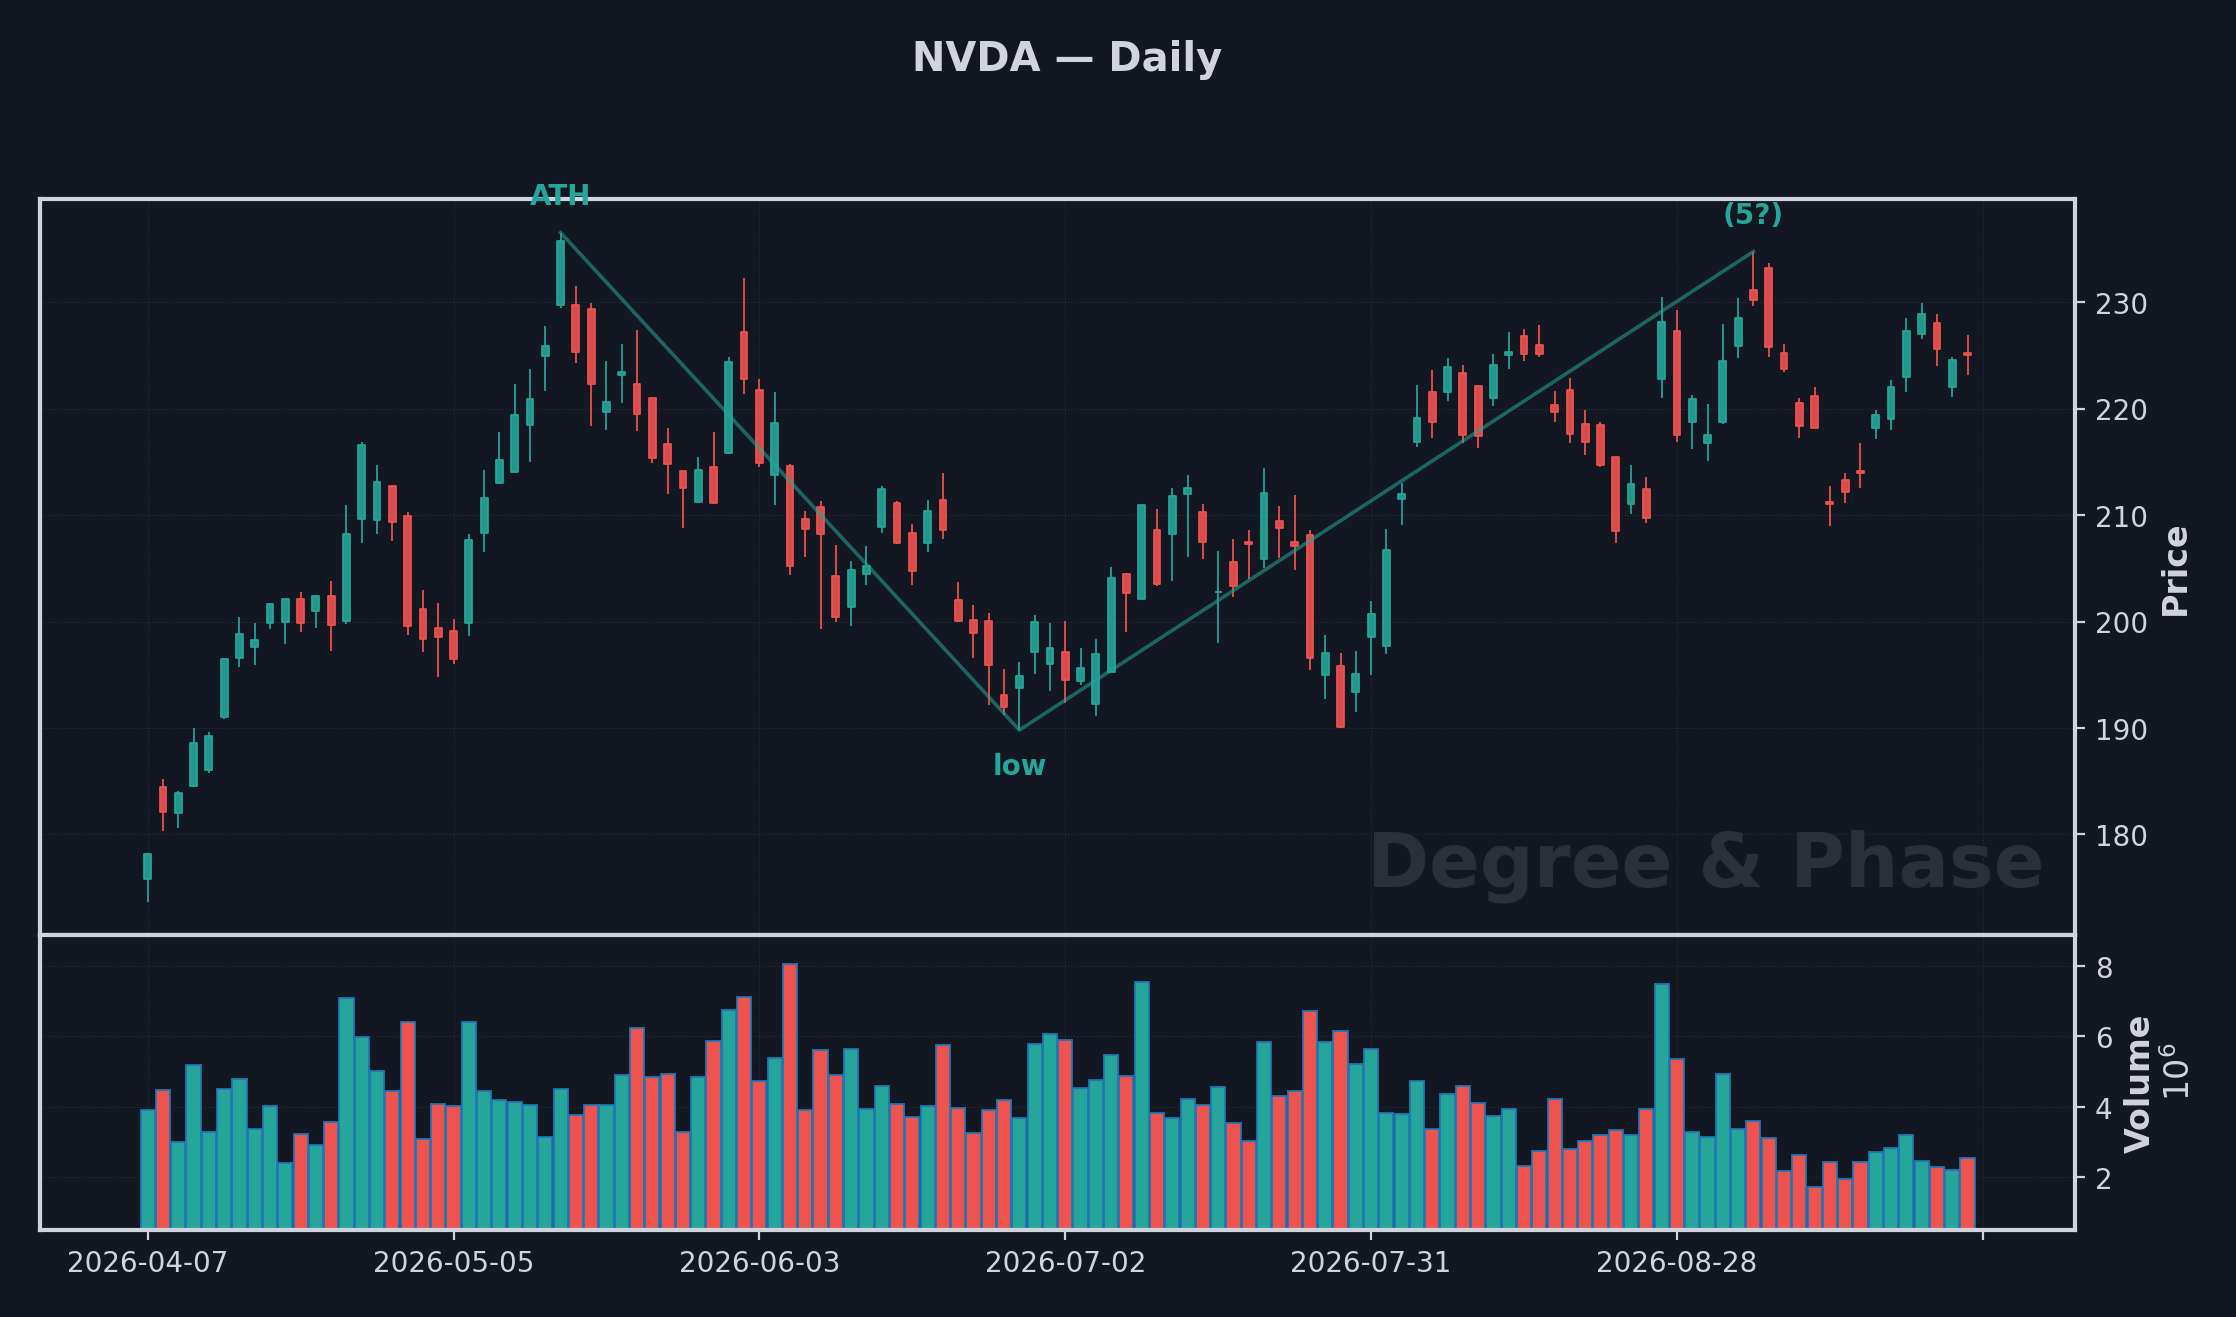
The primary structure is worked on QQQ (clean license); the Mag 7 names are the cross-validation. Below: our produced, wave-annotated QQQ daily chart, plus a quick read on two of the leaders. NQ futures carry the structural work referenced in the cards above.
Setups are for members.
The full setups (Mag 7, SPCX, QQQ, and NQ, with live levels and conviction) move behind membership as the site grows. Membership runs about $100 a month when it opens. Join the free list now and lock in a founding rate far below that.
Start free with the weekly Nasdaq read. When membership opens at about $100 a month, early readers stay locked far lower, for good.